scipy.interpolate.
spalde#
- scipy.interpolate.spalde(x, tck)[source]#
在给定一个(或一组)点上,评估B样条及其所有阶(最高为样条的度 k,其中0阶为样条本身)的导数。
旧版
此函数被视为旧版,将不再接收更新。虽然我们目前没有移除它的计划,但建议新代码使用更现代的替代方案。具体来说,我们建议构建一个
BSpline对象,并在循环或列表推导中评估其导数。- 参数:
- x类数组
用于评估导数的点或一组点。请注意,对于每个 x,必须满足
t(k) <= x <= t(n-k+1)。- tck元组
包含节点向量、B样条系数以及要计算其导数的样条的度 k 的元组 (t,c,k)。
- 返回:
- results{ndarray, ndarray 列表}
一个数组(或数组列表),包含每个点 x 的所有导数,最高到 k 阶(包括 k 阶),其中第一个元素是样条本身。
另请参阅
参考文献
[1]de Boor C : On calculating with b-splines, J. Approximation Theory 6 (1972) 50-62.
[2]Cox M.G. : The numerical evaluation of b-splines, J. Inst. Maths applics 10 (1972) 134-149.
[3]Dierckx P. : Curve and surface fitting with splines, Monographs on Numerical Analysis, Oxford University Press, 1993.
示例
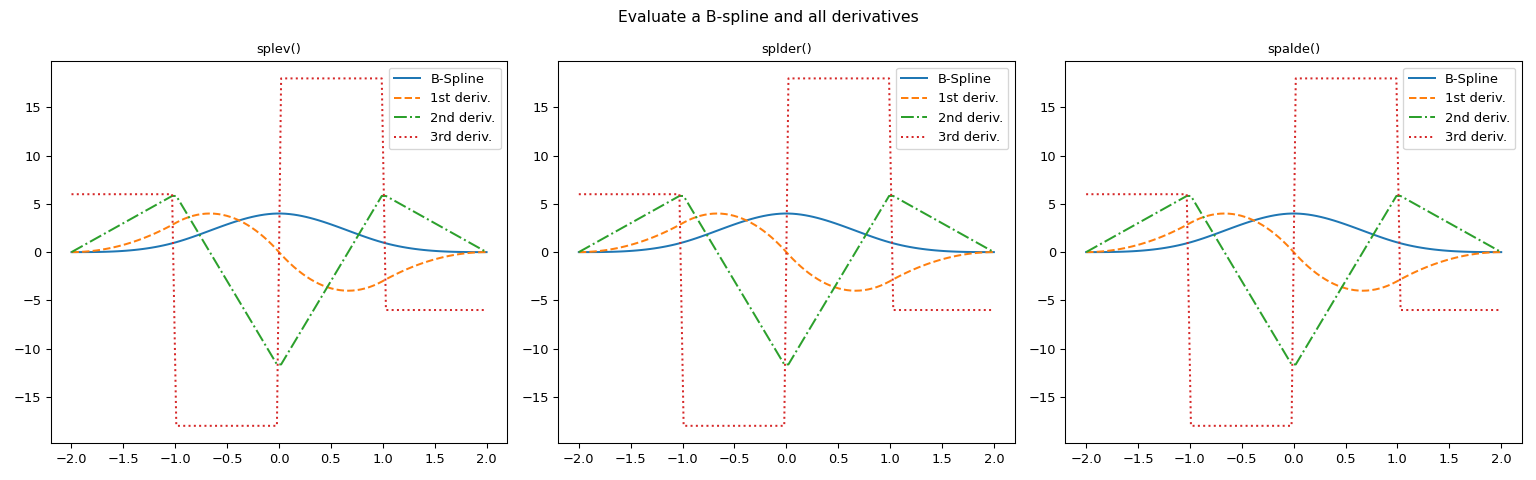
计算B样条的导数有几种方法。在此示例中,我们将演示
spalde等同于调用splev和splder。>>> import numpy as np >>> import matplotlib.pyplot as plt >>> from scipy.interpolate import BSpline, spalde, splder, splev
>>> # Store characteristic parameters of a B-spline
>>> tck = ((-2, -2, -2, -2, -1, 0, 1, 2, 2, 2, 2),  # knots
...        (0, 0, 0, 6, 0, 0, 0),  # coefficients
...        3)  # degree (cubic)
>>> # Instance a B-spline object
>>> # `BSpline` objects are preferred, except for spalde()
>>> bspl = BSpline(tck[0], tck[1], tck[2])
>>> # Generate extra points to get a smooth curve
>>> x = np.linspace(min(tck[0]), max(tck[0]), 100)
评估曲线和所有导数
>>> # The order of derivative must be less or equal to k, the degree of the spline
>>> # Method 1: spalde()
>>> f1_y_bsplin = [spalde(i, tck)[0] for i in x ]  # The B-spline itself
>>> f1_y_deriv1 = [spalde(i, tck)[1] for i in x ]  # 1st derivative
>>> f1_y_deriv2 = [spalde(i, tck)[2] for i in x ]  # 2nd derivative
>>> f1_y_deriv3 = [spalde(i, tck)[3] for i in x ]  # 3rd derivative
>>> # You can reach the same result by using `splev`and `splder`
>>> f2_y_deriv3 = splev(x, bspl, der=3)
>>> f3_y_deriv3 = splder(bspl, n=3)(x)
>>> # Generate a figure with three axes for graphic comparison
>>> fig, (ax1, ax2, ax3) = plt.subplots(1, 3, figsize=(16, 5))
>>> suptitle = fig.suptitle(f'Evaluate a B-spline and all derivatives')
>>> # Plot B-spline and all derivatives using the three methods
>>> orders = range(4)
>>> linetypes = ['-', '--', '-.', ':']
>>> labels = ['B-Spline', '1st deriv.', '2nd deriv.', '3rd deriv.']
>>> functions = ['splev()', 'splder()', 'spalde()']
>>> for order, linetype, label in zip(orders, linetypes, labels):
...     ax1.plot(x, splev(x, bspl, der=order), linetype, label=label)
...     ax2.plot(x, splder(bspl, n=order)(x), linetype, label=label)
...     ax3.plot(x, [spalde(i, tck)[order] for i in x], linetype, label=label)
>>> for ax, function in zip((ax1, ax2, ax3), functions):
...     ax.set_title(function)
...     ax.legend()
>>> plt.tight_layout()
>>> plt.show()