BSpline#
- class scipy.interpolate.BSpline(t, c, k, extrapolate=True, axis=0)[source]#
B-样条基中的单变量样条。
\[S(x) = \sum_{j=0}^{n-1} c_j B_{j, k; t}(x)\]其中 \(B_{j, k; t}\) 是度为 k、节点为 t 的 B-样条基函数。
- 参数:
- tndarray, 形状 (n+k+1,)
节点
- cndarray, 形状 (>=n, …)
样条系数
- kint
B-样条度
- extrapolatebool 或 ‘periodic’, 可选
是否在基本区间
t[k] .. t[n]之外进行外推,或返回 NaN。如果为 True,则外推基本区间上 B-样条函数的第一和最后多项式片段。如果为 ‘periodic’,则使用周期外推。默认为 True。- axisint, 可选
插值轴。默认为零。
- 属性:
- tndarray
节点向量
- cndarray
样条系数
- kint
样条度
- extrapolatebool
如果为 True,则外推基本区间上 B-样条函数的第一和最后多项式片段。
- axisint
插值轴。
tcktuple等同于
(self.t, self.c, self.k)(只读)。
方法
__call__(x[, nu, extrapolate])评估样条函数。
basis_element(t[, extrapolate])返回 B-样条基元素
B(x | t[0], ..., t[k+1])。derivative([nu])返回表示导数的 B-样条。
antiderivative([nu])返回表示反导数的 B-样条。
integrate(a, b[, extrapolate])计算样条的定积分。
insert_knot(x[, m])在 x 处插入一个重数为 m 的新节点。
construct_fast(t, c, k[, extrapolate, axis])在不进行检查的情况下构造样条。
design_matrix(x, t, k[, extrapolate])以 CSR 格式稀疏数组的形式返回设计矩阵。
from_power_basis(pp[, bc_type])从幂基中的分段多项式构造 B-样条基中的多项式。
注意
B-样条基元素定义如下:
\[ \begin{align}\begin{aligned}B_{i, 0}(x) = 1, \textrm{if $t_i \le x < t_{i+1}$, otherwise $0$,}\\B_{i, k}(x) = \frac{x - t_i}{t_{i+k} - t_i} B_{i, k-1}(x) + \frac{t_{i+k+1} - x}{t_{i+k+1} - t_{i+1}} B_{i+1, k-1}(x)\end{aligned}\end{align} \]实现细节
对于度为 k 的样条,至少需要
k+1个系数,即n >= k+1。额外的系数,即j > n的c[j],将被忽略。度为 k 的 B-样条基元素在基本区间
t[k] <= x <= t[n]上构成单位分解。
参考
[1]Tom Lyche 和 Knut Morken, 样条方法, http://www.uio.no/studier/emner/matnat/ifi/INF-MAT5340/v05/undervisningsmateriale/
[2]Carl de Boor, 样条实用指南, Springer, 2001。
示例
将 B-样条的递归定义转换为 Python 代码,我们有:
>>> def B(x, k, i, t):
...    if k == 0:
...       return 1.0 if t[i] <= x < t[i+1] else 0.0
...    if t[i+k] == t[i]:
...       c1 = 0.0
...    else:
...       c1 = (x - t[i])/(t[i+k] - t[i]) * B(x, k-1, i, t)
...    if t[i+k+1] == t[i+1]:
...       c2 = 0.0
...    else:
...       c2 = (t[i+k+1] - x)/(t[i+k+1] - t[i+1]) * B(x, k-1, i+1, t)
...    return c1 + c2
>>> def bspline(x, t, c, k):
...    n = len(t) - k - 1
...    assert (n >= k+1) and (len(c) >= n)
...    return sum(c[i] * B(x, k, i, t) for i in range(n))
请注意,这是一种评估 B-样条的低效(但直接)方式——此样条类以一种等效但更高效的方式进行评估。
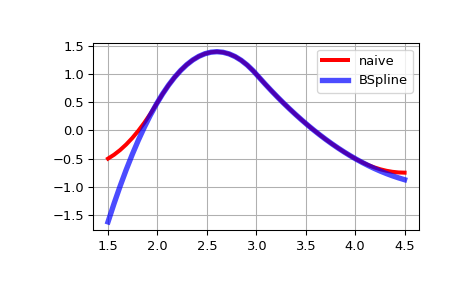
这里我们在基本区间
2 <= x <= 4上构造一个二次样条函数,并与评估样条的朴素方式进行比较。>>> from scipy.interpolate import BSpline >>> k = 2 >>> t = [0, 1, 2, 3, 4, 5, 6] >>> c = [-1, 2, 0, -1] >>> spl = BSpline(t, c, k) >>> spl(2.5) array(1.375) >>> bspline(2.5, t, c, k) 1.375
请注意,在基本区间之外,结果会有所不同。这是因为
BSpline会外推基本区间上 B-样条函数的第一和最后多项式片段。>>> import matplotlib.pyplot as plt >>> import numpy as np >>> fig, ax = plt.subplots() >>> xx = np.linspace(1.5, 4.5, 50) >>> ax.plot(xx, [bspline(x, t, c ,k) for x in xx], 'r-', lw=3, label='naive') >>> ax.plot(xx, spl(xx), 'b-', lw=4, alpha=0.7, label='BSpline') >>> ax.grid(True) >>> ax.legend(loc='best') >>> plt.show()
