CubicSpline#
- class scipy.interpolate.CubicSpline(x, y, axis=0, bc_type='not-a-knot', extrapolate=None)[source]#
分段三次插值器,用于拟合值(C2 光滑)。
使用分段三次多项式对数据进行插值,该多项式是二次连续可微的 [1]。结果表示为一个
PPoly实例,其断点与给定数据匹配。- 参数:
- xarray_like, 形状 (n,)
包含自变量值的一维数组。值必须是实数、有限且严格递增。
- yarray_like
包含因变量值的数组。它可以具有任意数量的维度,但沿
axis(见下文)的长度必须与x的长度匹配。值必须是有限的。- axisint, 可选
假定 y 沿此轴变化。这意味着对于
x[i],对应的值是np.take(y, i, axis=axis)。默认为 0。- bc_typestring 或 2-tuple, 可选
边界条件类型。需要由边界条件给出的两个额外方程来确定每个段上多项式的所有系数 [2]。
如果 bc_type 是字符串,则指定的条件将应用于样条的两端。可用条件有:
‘not-a-knot’(默认):曲线末端的第一段和第二段是相同的多项式。当没有边界条件信息时,这是一个很好的默认值。
‘periodic’:假定插值函数是周期性的,周期为
x[-1] - x[0]。y 的第一个值和最后一个值必须相同:y[0] == y[-1]。此边界条件将导致y'[0] == y'[-1]和y''[0] == y''[-1]。‘clamped’:曲线末端的一阶导数为零。假设一维 y,
bc_type=((1, 0.0), (1, 0.0))是相同的条件。‘natural’:曲线末端的二阶导数为零。假设一维 y,
bc_type=((2, 0.0), (2, 0.0))是相同的条件。
如果 bc_type 是一个 2 元组,则第一个值和第二个值将分别应用于曲线的起点和终点。元组值可以是前面提到的字符串之一(除了 ‘periodic’),或者是一个元组
(order, deriv_values),允许指定曲线末端的任意导数。order:导数阶数,1 或 2。
deriv_value:array_like,包含导数值,形状必须与 y 相同,不包括
axis维度。例如,如果 y 是一维的,则 deriv_value 必须是标量。如果 y 是三维的,形状为 (n0, n1, n2) 且 axis=2,则 deriv_value 必须是二维的,形状为 (n0, n1)。
- extrapolate{bool, ‘periodic’, None}, 可选
如果为 bool,则根据第一个和最后一个区间确定是否外推到界外点,或者返回 NaN。如果为 ‘periodic’,则使用周期外推。如果为 None(默认),则
extrapolate对于bc_type='periodic'设置为 ‘periodic’,否则设置为 True。
- 属性:
- xndarray, 形状 (n,)
断点。与传递给构造函数的
x相同。- cndarray, 形状 (4, n-1, …)
每个段上多项式的系数。尾部维度与 y 的维度匹配,不包括
axis。例如,如果 y 是一维的,则c[k, i]是在x[i]和x[i+1]之间的段上(x-x[i])**(3-k)的系数。- axisint
插值轴。与传递给构造函数的轴相同。
方法
__call__(x[, nu, extrapolate])评估分段多项式或其导数。
derivative([nu])构造一个新的分段多项式表示导数。
antiderivative([nu])构造一个新的分段多项式表示反导数。
integrate(a, b[, extrapolate])计算分段多项式的定积分。
solve([y, discontinuity, extrapolate])求解方程
pp(x) == y的实数解。roots([discontinuity, extrapolate])找到分段多项式的实数根。
另请参阅
Akima1DInterpolatorAkima 一维插值器。
PchipInterpolatorPCHIP 一维单调三次插值器。
PPoly以系数和断点表示的分段多项式。
备注
参数 bc_type 和
extrapolate独立工作,即前者仅控制样条的构建,后者仅控制评估。当边界条件是 ‘not-a-knot’ 且 n = 2 时,它会被替换为一阶导数等于线性插值斜率的条件。当两个边界条件都是 ‘not-a-knot’ 且 n = 3 时,解被视为通过给定点的抛物线。
当 ‘not-a-knot’ 边界条件应用于两端时,生成的样条将与
splrep(带s=0)和InterpolatedUnivariateSpline返回的样条相同,但后两种方法使用 B 样条基表示。新增于 0.18.0 版本。
参考文献
示例
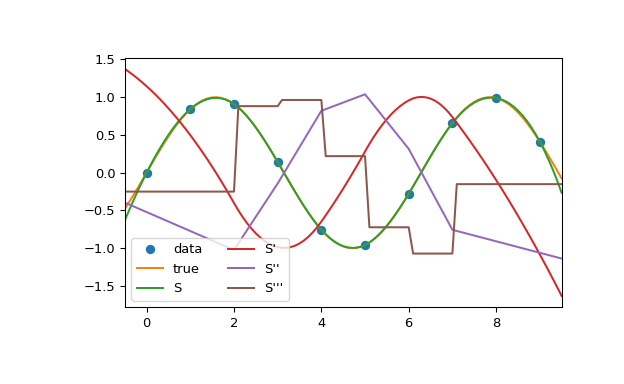
在此示例中,三次样条用于插值采样的正弦曲线。您可以看到样条连续性属性对于一阶和二阶导数成立,仅对于三阶导数不成立。
>>> import numpy as np
>>> from scipy.interpolate import CubicSpline
>>> import matplotlib.pyplot as plt
>>> x = np.arange(10)
>>> y = np.sin(x)
>>> cs = CubicSpline(x, y)
>>> xs = np.arange(-0.5, 9.6, 0.1)
>>> fig, ax = plt.subplots(figsize=(6.5, 4))
>>> ax.plot(x, y, 'o', label='data')
>>> ax.plot(xs, np.sin(xs), label='true')
>>> ax.plot(xs, cs(xs), label="S")
>>> ax.plot(xs, cs(xs, 1), label="S'")
>>> ax.plot(xs, cs(xs, 2), label="S''")
>>> ax.plot(xs, cs(xs, 3), label="S'''")
>>> ax.set_xlim(-0.5, 9.5)
>>> ax.legend(loc='lower left', ncol=2)
>>> plt.show()

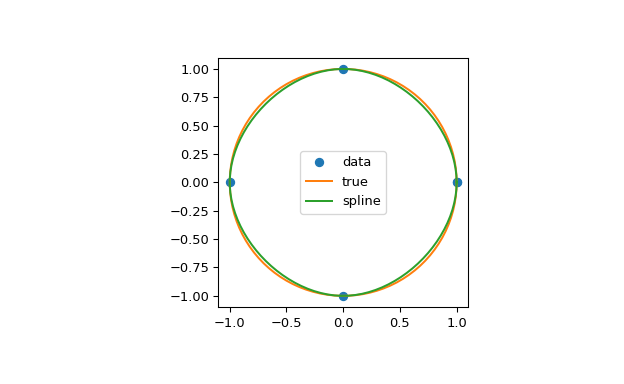
在第二个示例中,单位圆用样条插值。使用了周期边界条件。您可以看到在周期点 (1, 0) 处,一阶导数值 ds/dx=0, ds/dy=1 被正确计算。请注意,圆不能通过三次样条精确表示。为了提高精度,需要更多的断点。
>>> theta = 2 * np.pi * np.linspace(0, 1, 5)
>>> y = np.c_[np.cos(theta), np.sin(theta)]
>>> cs = CubicSpline(theta, y, bc_type='periodic')
>>> print("ds/dx={:.1f} ds/dy={:.1f}".format(cs(0, 1)[0], cs(0, 1)[1]))
ds/dx=0.0 ds/dy=1.0
>>> xs = 2 * np.pi * np.linspace(0, 1, 100)
>>> fig, ax = plt.subplots(figsize=(6.5, 4))
>>> ax.plot(y[:, 0], y[:, 1], 'o', label='data')
>>> ax.plot(np.cos(xs), np.sin(xs), label='true')
>>> ax.plot(cs(xs)[:, 0], cs(xs)[:, 1], label='spline')
>>> ax.axes.set_aspect('equal')
>>> ax.legend(loc='center')
>>> plt.show()

第三个示例是在区间 0 <= x <= 1 上对多项式 y = x**3 进行插值。三次样条可以精确表示此函数。为此,我们需要指定区间端点的值和一阶导数。请注意 y' = 3 * x**2,因此 y'(0) = 0 且 y'(1) = 3。
>>> cs = CubicSpline([0, 1], [0, 1], bc_type=((1, 0), (1, 3)))
>>> x = np.linspace(0, 1)
>>> np.allclose(x**3, cs(x))
True