scipy.signal.
dbode#
- scipy.signal.dbode(system, w=None, n=100)[源代码]#
计算离散时间系统的伯德幅度和相位数据。
- 参数:
- systemdlti | 元组
LTI 类
dlti的实例,或描述系统的元组。元组中元素的数量决定了其解释方式。例如:system: LTI 类dlti的实例。请注意,也允许使用派生实例,例如TransferFunction、ZerosPolesGain或StateSpace的实例。(num, den, dt):TransferFunction中描述的有理多项式。多项式的系数应按降幂顺序指定,例如,z² + 3z + 5 将表示为[1, 3, 5]。(zeros, poles, gain, dt):ZerosPolesGain中描述的零点、极点、增益形式。(A, B, C, D, dt):StateSpace中描述的状态空间形式。
- warray_like, 可选
频率数组,归一化到奈奎斯特频率 π,即单位为弧度/样本。将为该数组中的每个值计算幅度和相位数据。如果未给出,将计算一组合理的值。
- nint, 可选
如果未给出 w,则计算的频率点数。这 n 个频率在选择的区间内对数分布,该区间旨在包含系统零点和极点的影响。
- 返回:
- w1D ndarray
频率数组,归一化到奈奎斯特频率
np.pi/dt,其中dt是 system 参数的采样间隔。假设dt以秒为单位,则单位为 rad/s。- mag1D ndarray
幅度数组,单位为 dB
- phase1D ndarray
相位数组,单位为度
备注
此函数是
dfreqresp的便捷包装器,用于从计算出的频率响应复数值振幅中提取幅度和相位。在 0.18.0 版本中新增。
示例
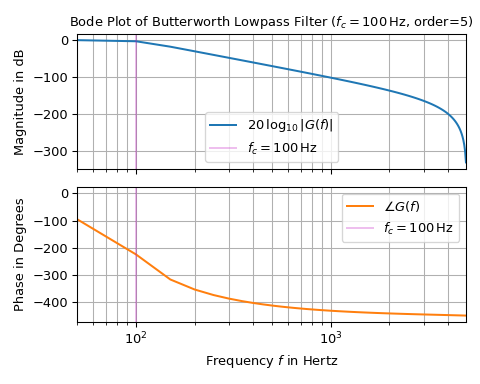
以下示例展示了如何创建具有 100 Hz 截止频率的 5 阶巴特沃斯低通滤波器的伯德图
>>> import matplotlib.pyplot as plt
>>> import numpy as np
>>> from scipy import signal
...
>>> T = 1e-4  # sampling interval in s
>>> f_c, o = 1e2, 5  # corner frequency in Hz (i.e., -3 dB value) and filter order
>>> bb, aa = signal.butter(o, f_c, 'lowpass', fs=1/T)
...
>>> w, mag, phase = signal.dbode((bb, aa, T))
>>> w /= 2*np.pi  # convert unit of frequency into Hertz
...
>>> fg, (ax0, ax1) = plt.subplots(2, 1, sharex='all', figsize=(5, 4),
...                               tight_layout=True)
>>> ax0.set_title("Bode Plot of Butterworth Lowpass Filter " +
...               rf"($f_c={f_c:g}\,$Hz, order={o})")
>>> ax0.set_ylabel(r"Magnitude in dB")
>>> ax1.set(ylabel=r"Phase in Degrees",
...         xlabel="Frequency $f$ in Hertz", xlim=(w[1], w[-1]))
>>> ax0.semilogx(w, mag, 'C0-', label=r"$20\,\log_{10}|G(f)|$")  # Magnitude plot
>>> ax1.semilogx(w, phase, 'C1-', label=r"$\angle G(f)$")  # Phase plot
...
>>> for ax_ in (ax0, ax1):
...     ax_.axvline(f_c, color='m', alpha=0.25, label=rf"${f_c=:g}\,$Hz")
...     ax_.grid(which='both', axis='x')  # plot major & minor vertical grid lines
...     ax_.grid(which='major', axis='y')
...     ax_.legend()
>>> plt.show()