scipy.stats.
yeojohnson#
- scipy.stats.yeojohnson(x, lmbda=None)[源代码]#
返回通过 Yeo-Johnson 幂变换转换的数据集。
- 参数:
- xndarray
输入数组。应为一维。
- lmbdafloat, 可选
如果
lmbda为None,则找到最大化对数似然函数的 lambda,并将其作为第二个输出参数返回。否则,将对给定值进行转换。
- 返回值:
- yeojohnson: ndarray
Yeo-Johnson 幂变换数组。
- maxlogfloat, 可选
如果 lmbda 参数为 None,则第二个返回的参数是最大化对数似然函数的 lambda。
注释
Yeo-Johnson 变换由下式给出
\[\begin{split}y = \begin{cases} \frac{(x + 1)^\lambda - 1}{\lambda}, &\text{for } x \geq 0, \lambda \neq 0 \\ \log(x + 1), &\text{for } x \geq 0, \lambda = 0 \\ -\frac{(-x + 1)^{2 - \lambda} - 1}{2 - \lambda}, &\text{for } x < 0, \lambda \neq 2 \\ -\log(-x + 1), &\text{for } x < 0, \lambda = 2 \end{cases}\end{split}\]与
boxcox不同,yeojohnson不要求输入数据为正数。1.2.0 版本新增。
参考文献
I. Yeo 和 R.A. Johnson, “一种改进正态性或对称性的新的幂变换族”, Biometrika 87.4 (2000)
示例
>>> from scipy import stats
>>> import matplotlib.pyplot as plt
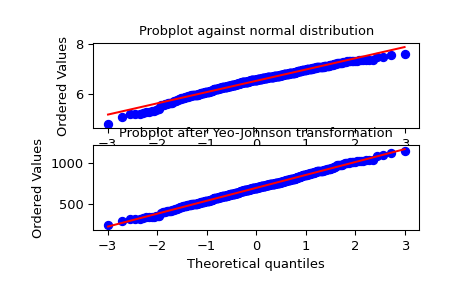
我们从一个非正态分布中生成一些随机变量,并为其制作一个概率图,以显示它在尾部是非正态的
>>> fig = plt.figure()
>>> ax1 = fig.add_subplot(211)
>>> x = stats.loggamma.rvs(5, size=500) + 5
>>> prob = stats.probplot(x, dist=stats.norm, plot=ax1)
>>> ax1.set_xlabel('')
>>> ax1.set_title('Probplot against normal distribution')
我们现在使用
yeojohnson转换数据,使其最接近正态>>> ax2 = fig.add_subplot(212) >>> xt, lmbda = stats.yeojohnson(x) >>> prob = stats.probplot(xt, dist=stats.norm, plot=ax2) >>> ax2.set_title('Probplot after Yeo-Johnson transformation')
>>> plt.show()