scipy.stats.vonmises_fisher#
- scipy.stats.vonmises_fisher = <scipy.stats._multivariate.vonmises_fisher_gen object>[source]#
一个冯·米塞斯-费舍尔 (von Mises-Fisher) 变量。
mu 关键字指定平均方向向量。 kappa 关键字指定集中度参数。
- 参数:
- muarray_like
分布的平均方向。 必须是范数为 1 的一维单位向量。
- kappafloat
集中度参数。 必须为正数。
- seed{None, int, np.random.RandomState, np.random.Generator}, optional
用于绘制随机变量。 如果 seed 为 None,则使用 RandomState 单例。 如果 seed 是一个整数,则使用一个新的
RandomState实例,并使用 seed 作为种子。 如果 seed 已经是一个RandomState或Generator实例,则使用该对象。 默认为 None。
方法
pdf(x, mu=None, kappa=1)
概率密度函数。
logpdf(x, mu=None, kappa=1)
概率密度函数的对数。
rvs(mu=None, kappa=1, size=1, random_state=None)
从冯·米塞斯-费舍尔分布中抽取随机样本。
entropy(mu=None, kappa=1)
计算冯·米塞斯-费舍尔分布的微分熵。
fit(data)
将冯·米塞斯-费舍尔分布拟合到数据。
另请参阅
scipy.stats.vonmises圆形上 2D 冯·米塞斯-费舍尔分布
uniform_direction超球面表面上的均匀分布
说明
冯·米塞斯-费舍尔分布是单位超球面表面上的定向分布。 单位向量 \(\mathbf{x}\) 的概率密度函数为
\[f(\mathbf{x}) = \frac{\kappa^{d/2-1}}{(2\pi)^{d/2}I_{d/2-1}(\kappa)} \exp\left(\kappa \mathbf{\mu}^T\mathbf{x}\right),\]其中 \(\mathbf{\mu}\) 是平均方向,\(\kappa\) 是集中度参数,\(d\) 是维度,\(I\) 是第一类修正贝塞尔函数。 由于 \(\mu\) 表示方向,因此它必须是单位向量,或者换句话说,是超球面上的一个点:\(\mathbf{\mu}\in S^{d-1}\)。 \(\kappa\) 是集中度参数,这意味着它必须是正数 (\(\kappa>0\)),并且分布会随着 \(\kappa\) 的增加而变得更窄。 从这个意义上讲,倒数值 \(1/\kappa\) 类似于正态分布的方差参数。
冯·米塞斯-费舍尔分布通常用作球面上正态分布的类似物。 直观上,对于单位向量,有用的距离度量由它们之间的角度 \(\alpha\) 给出。 这正是冯·米塞斯-费舍尔概率密度函数中描述的标量积 \(\mathbf{\mu}^T\mathbf{x}=\cos(\alpha)\):平均方向 \(\mathbf{\mu}\) 和向量 \(\mathbf{x}\) 之间的角度。 它们之间的角度越大,对于这个特定的平均方向 \(\mathbf{\mu}\) 观察到 \(\mathbf{x}\) 的概率就越小。
在维度 2 和 3 中,使用专门的算法进行快速采样 [2], [3]。 对于维度为 4 或更高的维度,使用 [4] 中描述的拒绝抽样算法。 此实现部分基于 geomstats 包 [5], [6]。
1.11 版本中新增。
参考文献
[1]Von Mises-Fisher distribution, Wikipedia, https://en.wikipedia.org/wiki/Von_Mises%E2%80%93Fisher_distribution
[2]Mardia, K., and Jupp, P. 定向统计。 Wiley, 2000.
[3]J. Wenzel。 S2 上冯·米塞斯-费舍尔分布的数值稳定采样。 https://www.mitsuba-renderer.org/~wenzel/files/vmf.pdf
[4]Wood, A. 冯·米塞斯-费舍尔分布的模拟。 统计-模拟和计算中的通信 23, 1 (1994), 157-164。 https://doi.org/10.1080/03610919408813161
[5]geomstats, Github。 MIT 许可证。 访问时间:06.01.2023。 geomstats/geomstats
[6]Miolane, N. et al. Geomstats:用于机器学习中黎曼几何的 Python 包。 机器学习研究杂志 21 (2020)。 http://jmlr.org/papers/v21/19-027.html
示例
概率密度的可视化
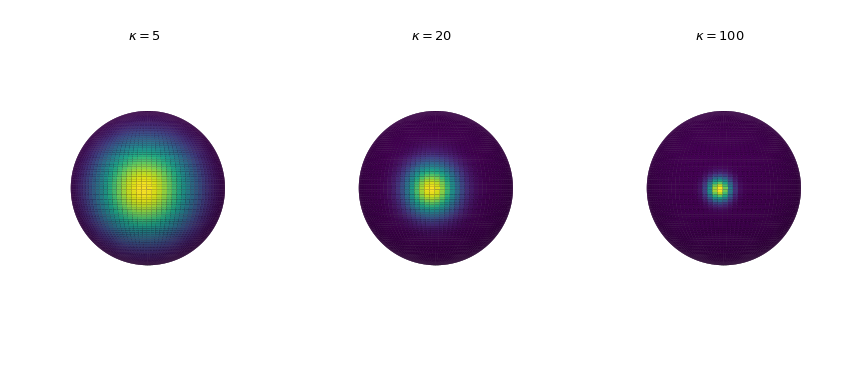
绘制三个维度中概率密度,以增加集中度参数。 密度由
pdf方法计算。>>> import numpy as np >>> import matplotlib.pyplot as plt >>> from scipy.stats import vonmises_fisher >>> from matplotlib.colors import Normalize >>> n_grid = 100 >>> u = np.linspace(0, np.pi, n_grid) >>> v = np.linspace(0, 2 * np.pi, n_grid) >>> u_grid, v_grid = np.meshgrid(u, v) >>> vertices = np.stack([np.cos(v_grid) * np.sin(u_grid), ... np.sin(v_grid) * np.sin(u_grid), ... np.cos(u_grid)], ... axis=2) >>> x = np.outer(np.cos(v), np.sin(u)) >>> y = np.outer(np.sin(v), np.sin(u)) >>> z = np.outer(np.ones_like(u), np.cos(u)) >>> def plot_vmf_density(ax, x, y, z, vertices, mu, kappa): ... vmf = vonmises_fisher(mu, kappa) ... pdf_values = vmf.pdf(vertices) ... pdfnorm = Normalize(vmin=pdf_values.min(), vmax=pdf_values.max()) ... ax.plot_surface(x, y, z, rstride=1, cstride=1, ... facecolors=plt.cm.viridis(pdfnorm(pdf_values)), ... linewidth=0) ... ax.set_aspect('equal') ... ax.view_init(azim=-130, elev=0) ... ax.axis('off') ... ax.set_title(rf"$\kappa={kappa}$") >>> fig, axes = plt.subplots(nrows=1, ncols=3, figsize=(9, 4), ... subplot_kw={"projection": "3d"}) >>> left, middle, right = axes >>> mu = np.array([-np.sqrt(0.5), -np.sqrt(0.5), 0]) >>> plot_vmf_density(left, x, y, z, vertices, mu, 5) >>> plot_vmf_density(middle, x, y, z, vertices, mu, 20) >>> plot_vmf_density(right, x, y, z, vertices, mu, 100) >>> plt.subplots_adjust(top=1, bottom=0.0, left=0.0, right=1.0, wspace=0.) >>> plt.show()

当我们增加集中度参数时,这些点会更紧密地聚集在平均方向周围。
抽样
使用
rvs方法从分布中抽取 5 个样本,得到一个 5x3 数组。>>> rng = np.random.default_rng() >>> mu = np.array([0, 0, 1]) >>> samples = vonmises_fisher(mu, 20).rvs(5, random_state=rng) >>> samples array([[ 0.3884594 , -0.32482588, 0.86231516], [ 0.00611366, -0.09878289, 0.99509023], [-0.04154772, -0.01637135, 0.99900239], [-0.14613735, 0.12553507, 0.98126695], [-0.04429884, -0.23474054, 0.97104814]])
这些样本是球面 \(S^2\) 上的单位向量。 为了验证,让我们计算它们的欧几里得范数
>>> np.linalg.norm(samples, axis=1)
array([1., 1., 1., 1., 1.])
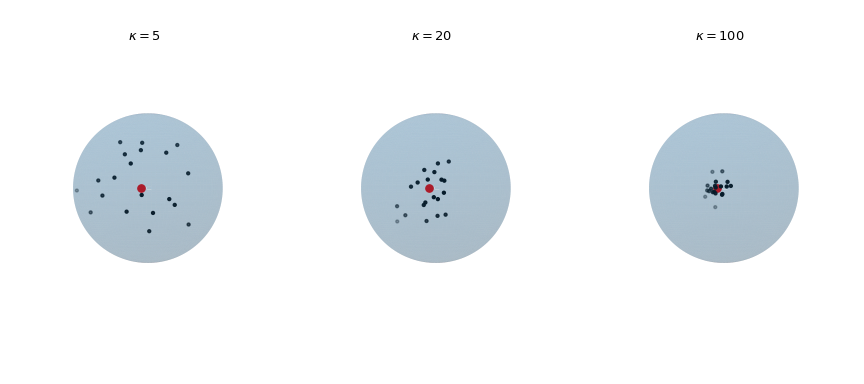
绘制从冯·米塞斯-费舍尔分布中抽取的 20 个观测值,以增加集中度参数 \(\kappa\)。 红点突出显示平均方向 \(\mu\)。
>>> def plot_vmf_samples(ax, x, y, z, mu, kappa):
...     vmf = vonmises_fisher(mu, kappa)
...     samples = vmf.rvs(20)
...     ax.plot_surface(x, y, z, rstride=1, cstride=1, linewidth=0,
...                     alpha=0.2)
...     ax.scatter(samples[:, 0], samples[:, 1], samples[:, 2], c='k', s=5)
...     ax.scatter(mu[0], mu[1], mu[2], c='r', s=30)
...     ax.set_aspect('equal')
...     ax.view_init(azim=-130, elev=0)
...     ax.axis('off')
...     ax.set_title(rf"$\kappa={kappa}$")
>>> mu = np.array([-np.sqrt(0.5), -np.sqrt(0.5), 0])
>>> fig, axes = plt.subplots(nrows=1, ncols=3,
...                          subplot_kw={"projection": "3d"},
...                          figsize=(9, 4))
>>> left, middle, right = axes
>>> plot_vmf_samples(left, x, y, z, mu, 5)
>>> plot_vmf_samples(middle, x, y, z, mu, 20)
>>> plot_vmf_samples(right, x, y, z, mu, 100)
>>> plt.subplots_adjust(top=1, bottom=0.0, left=0.0,
...                     right=1.0, wspace=0.)
>>> plt.show()

这些图表明,随着集中度 \(\kappa\) 的增加,得到的样本更紧密地集中在平均方向周围。
拟合分布参数
可以使用
fit方法将分布拟合到数据,从而返回估计的参数。 作为一个玩具示例,让我们将分布拟合到从已知的冯·米塞斯-费舍尔分布中抽取的样本。>>> mu, kappa = np.array([0, 0, 1]), 20 >>> samples = vonmises_fisher(mu, kappa).rvs(1000, random_state=rng) >>> mu_fit, kappa_fit = vonmises_fisher.fit(samples) >>> mu_fit, kappa_fit (array([0.01126519, 0.01044501, 0.99988199]), 19.306398751730995)
我们看到估计的参数 mu_fit 和 kappa_fit 非常接近于地面真值参数。