siegelslopes#
- scipy.stats.siegelslopes(y, x=None, method='hierarchical', *, axis=None, nan_policy='propagate', keepdims=False)[源代码]#
计算一组点 (x, y) 的 Siegel 估计量。
siegelslopes实现了一种使用重复中位数进行稳健线性回归的方法(参见 [1])以将直线拟合到点 (x, y)。该方法对异常值具有鲁棒性,具有 50% 的渐近击穿点。- 参数:
- yarray_like
因变量。
- xarray_like 或 None, 可选
自变量。如果为 None,则使用
arange(len(y))代替。- method{‘hierarchical’, ‘separate’}
如果为 ‘hierarchical’,则使用估计斜率
slope估计截距(默认选项)。如果为 ‘separate’,则独立于估计斜率估计截距。有关详细信息,请参见 Notes。- axisint 或 None, 默认值: None
如果为 int,则为计算统计量所沿的输入轴。输入的每个轴切片(例如,行)的统计量将出现在输出的相应元素中。如果为
None,则在计算统计量之前将展平输入。- nan_policy{‘propagate’, ‘omit’, ‘raise’}
定义如何处理输入 NaN。
propagate: 如果在计算统计量的轴切片(例如,行)中存在 NaN,则输出的相应条目将为 NaN。omit: 执行计算时将省略 NaN。如果在计算统计量的轴切片中剩余的数据不足,则输出的相应条目将为 NaN。raise: 如果存在 NaN,将引发ValueError。
- keepdimsbool, 默认值: False
如果将其设置为 True,则减小的轴将作为大小为 1 的维度保留在结果中。使用此选项,结果将正确地广播到输入数组。
- 返回值:
- result
SiegelslopesResult实例 返回值是一个具有以下属性的对象
- slopefloat
回归线的斜率估计。
- interceptfloat
回归线的截距估计。
- result
参见
theilslopes一种没有重复中位数的类似技术
注释
使用
n = len(y),将m_j计算为从点(x[j], y[j])到所有其他 n-1 个点的斜率的中位数。slope然后是所有斜率m_j的中位数。在 [1] 中给出了两种估计截距的方法,可以通过参数method进行选择。分层方法使用估计的斜率slope并将intercept计算为y - slope*x的中位数。另一种方法分别估计截距,如下所示:对于每个点(x[j], y[j]),计算通过剩余点的所有 n-1 条线的截距,并取中位数i_j。intercept是i_j的中位数。该实现计算 n 次大小为 n 的向量的中位数,对于大型向量来说,这可能会很慢。有一些更有效的算法(参见 [2]),但此处未实现。
为了与旧版本的 SciPy 兼容,返回值的作用类似于长度为 2 的
namedtuple,字段为slope和intercept,因此可以继续编写slope, intercept = siegelslopes(y, x)
从 SciPy 1.9 开始,
np.matrix输入(不建议用于新代码)在执行计算之前会转换为np.ndarray。在这种情况下,输出将是标量或具有适当形状的np.ndarray,而不是 2Dnp.matrix。同样,虽然会忽略屏蔽数组的屏蔽元素,但输出将是标量或np.ndarray,而不是mask=False的屏蔽数组。参考文献
[1] (1,2)A. Siegel, “Robust Regression Using Repeated Medians”, Biometrika, Vol. 69, pp. 242-244, 1982.
[2]A. Stein and M. Werman, “Finding the repeated median regression line”, Proceedings of the Third Annual ACM-SIAM Symposium on Discrete Algorithms, pp. 409-413, 1992.
示例
>>> import numpy as np
>>> from scipy import stats
>>> import matplotlib.pyplot as plt
>>> x = np.linspace(-5, 5, num=150)
>>> y = x + np.random.normal(size=x.size)
>>> y[11:15] += 10  # add outliers
>>> y[-5:] -= 7
计算斜率和截距。为了进行比较,还使用
linregress计算最小二乘拟合>>> res = stats.siegelslopes(y, x) >>> lsq_res = stats.linregress(x, y)
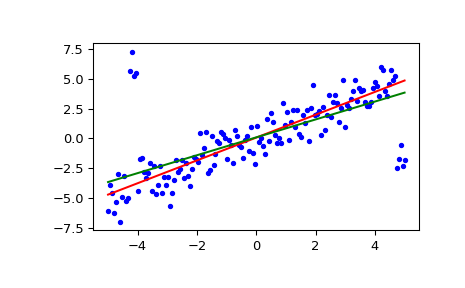
绘制结果。Siegel 回归线以红色显示。绿线显示用于比较的最小二乘拟合。
>>> fig = plt.figure()
>>> ax = fig.add_subplot(111)
>>> ax.plot(x, y, 'b.')
>>> ax.plot(x, res[1] + res[0] * x, 'r-')
>>> ax.plot(x, lsq_res[1] + lsq_res[0] * x, 'g-')
>>> plt.show()
