随机变量迁移指南#
背景#
在 SciPy 1.15 之前,所有 SciPy 的连续概率分布(例如 scipy.stats.norm)都是 scipy.stats.rv_continuous 子类的实例。
from scipy import stats
dist = stats.norm
type(dist)
scipy.stats._continuous_distns.norm_gen
isinstance(dist, stats.rv_continuous)
True
处理这些对象有两种显而易见的方式。
根据更常见的方式,"参数"(例如 x)和"分布参数"(例如 loc, scale)都作为输入提供给对象的方法。
x, loc, scale = 1., 0., 1.
dist.pdf(x, loc, scale)
np.float64(0.24197072451914337)
不太常见的方法是调用分布对象的 __call__ 方法,该方法返回 rv_continuous_frozen 的实例,无论原始类是什么。
frozen = stats.norm()
type(frozen)
scipy.stats._distn_infrastructure.rv_continuous_frozen
这个新对象的方法只接受参数,不接受分布参数。
frozen.pdf(x)
np.float64(0.24197072451914337)
从某种意义上说,rv_continuous 的实例(如 norm)代表“分布族”,它们需要参数来标识特定的概率分布,而 rv_continuous_frozen 的实例则类似于“随机变量”——一个遵循特定概率分布的数学对象。
两种方法都有效,并在某些情况下具有优势。例如,对于如此简单的调用或当方法被视为分布参数而不是通常参数(例如,似然)的函数时,stats.norm.pdf(x) 看起来比 stats.norm().pdf(x) 更自然。然而,前者有一些固有的缺点;例如,SciPy 的所有 125 个连续分布都必须在导入时实例化,每次调用方法时都必须验证分布参数,并且方法文档必须要么 a) 为每个分布的每个方法单独生成,要么 b) 省略每个分布独有的形状参数。为了解决这些和其他缺点,gh-15928 提出了一种基于后者(随机变量)方法的新独立基础设施。本迁移指南记录了 rv_continuous 和 rv_continuous_frozen 用户如何迁移到新的基础设施。
注意:新基础设施对于某些用例,尤其是将分布参数拟合到数据,可能还不够方便。如果旧基础设施适合您的需求,欢迎继续使用;目前它尚未被弃用。
基础知识#
在新的基础设施中,分布族类名遵循 CamelCase 约定。它们在使用前必须实例化,参数以仅关键字参数的形式传递。这些分布族类的实例可以被视为随机变量,在数学中通常用大写字母表示。
from scipy import stats
mu, sigma = 0, 1
X = stats.Normal(mu=mu, sigma=sigma)
X
Normal(mu=np.float64(0.0), sigma=np.float64(1.0))
一旦实例化,形状参数可以作为属性读取(但不可写入)。
X.mu, X.sigma
(np.float64(0.0), np.float64(1.0))
scipy.stats.Normal 的文档包含指向其每个方法的详细文档的链接。(例如,将其与 scipy.stats.norm 的文档进行比较。)
注意:尽管截至 SciPy 1.15,只有 Normal 和 Uniform 有已渲染的文档并且可以直接从 stats 导入,但几乎所有其他旧分布都可以通过 make_distribution(稍后讨论)与新接口一起使用。
然后通过仅传递参数(如果有)来调用方法,而不是传递分布参数。
X.mean()
np.float64(0.0)
X.pdf(x)
np.float64(0.24197072451914337)
对于这样的简单调用(例如,参数是有效的浮点数),调用新随机变量的方法通常会比调用旧分布方法更快。
%timeit X.pdf(x)
2.44 μs ± 1.49 ns per loop (mean ± std. dev. of 7 runs, 100,000 loops each)
%timeit frozen.pdf(x)
17.2 μs ± 39.4 ns per loop (mean ± std. dev. of 7 runs, 100,000 loops each)
%timeit dist.pdf(x, loc=mu, scale=sigma)
17.4 μs ± 185 ns per loop (mean ± std. dev. of 7 runs, 100,000 loops each)
注意 X.pdf 和 frozen.pdf 的调用方式是相同的,而 dist.pdf 的调用方式非常相似——唯一的区别是 dist.pdf 的调用包含了形状参数,而在新的基础设施中,形状参数只在随机变量实例化时提供。
除了 pdf 和 mean 之外,新基础设施的几个其他方法与旧方法基本相同。
logpdf(概率密度函数的对数)cdf(累积分布函数)logcdf(累积分布函数的对数)entropy(微分熵)中位数支持
其他方法有了新名称,但可以完全替代。
sf(生存函数) \(\rightarrow\)ccdf(互补累积分布函数)logsf\(\rightarrow\)logccdfppf(百分点函数) \(\rightarrow\)icdf(逆累积分布函数)isf(逆生存函数) \(\rightarrow\)iccdf(逆互补累积分布函数)std\(\rightarrow\)standard_deviationvar\(\rightarrow\)variance
新基础设施有几个与上述方法相似的新方法。
ilogcdf(累积分布函数对数的逆)ilogccdf(互补累积分布函数对数的逆)logentropy(熵的对数)mode(分布的众数)偏度kurtosis(非超额峰度;参见下文“标准化矩”)
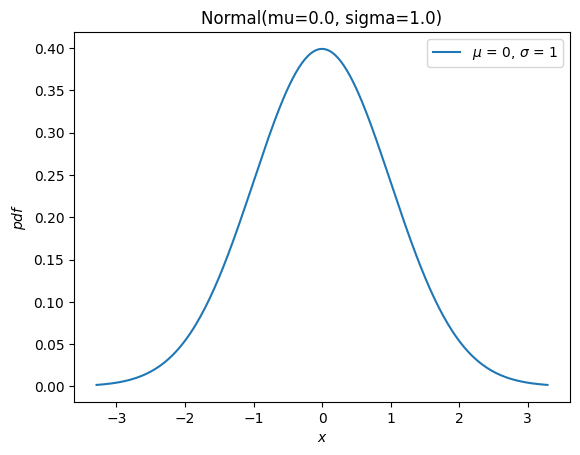
它还有一个新的 plot 方法,方便使用
import matplotlib.pyplot as plt
X.plot()
plt.show()
旧基础设施的其余大部分方法(rvs、moment、stats、interval、fit、nnlf、fit_loc_scale 和 expect)具有类似的功能,但需要一些注意。在描述替换之前,我们简要提一下如何处理非正态分布的随机变量:几乎所有旧的分布对象都可以通过 scipy.stats.make_distribution 转换为新的分布类,并且新的分布类可以通过将形状参数作为关键字参数传递来实例化。例如,考虑Weibull 分布。我们可以创建一个新的类,作为分布族的抽象,例如
Weibull = stats.make_distribution(stats.weibull_min)
print(Weibull.__doc__[:288])  # help(Weibull) prints this and (too much) more
This class represents `scipy.stats.weibull_min` as a subclass of `<class 'scipy.stats._distribution_infrastructure.ContinuousDistribution'>`.
The `repr`/`str` of class instances is `Weibull`.
The PDF of the distribution is defined for :math:`x \in [0.0, \infty]`.
This class accepts one p
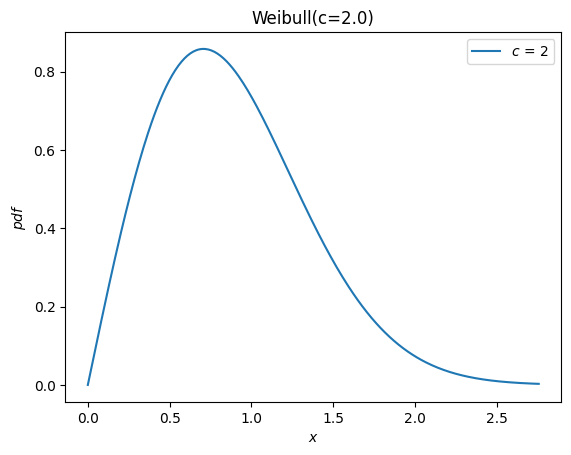
根据 weibull_min 的文档,形状参数表示为 c,因此我们可以通过将 c 作为关键字参数传递给新的 Weibull 类来实例化一个随机变量。
c = 2.
X = Weibull(c=c)
X.plot()
plt.show()
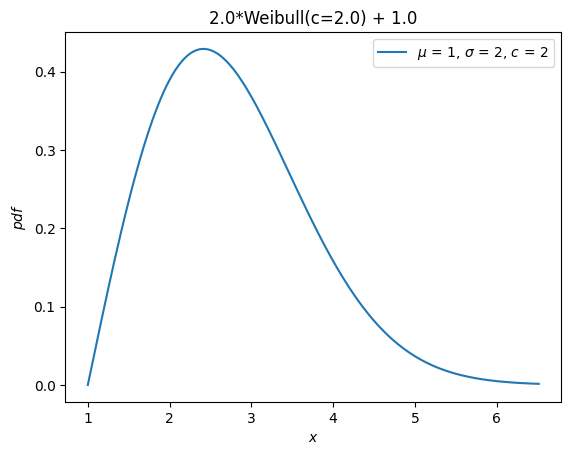
以前,所有分布都继承了 loc 和 scale 分布参数。这些参数不再被接受。 相反,随机变量可以通过算术运算符进行平移和缩放。
Y = 2*X + 1
Y.plot()  # note the change in the abscissae
plt.show()
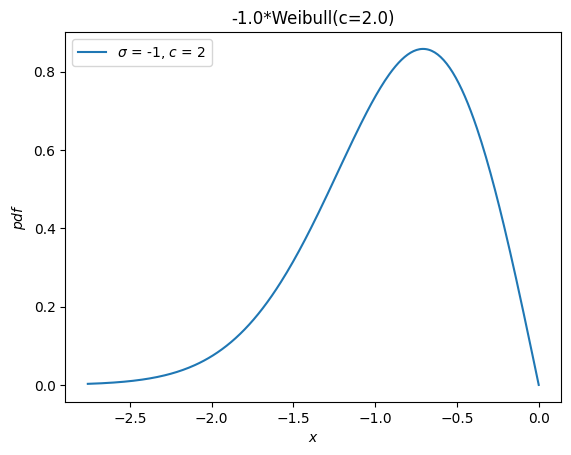
一个单独的分布,weibull_max,曾作为 weibull_min 关于原点的反射。现在,这仅仅是 -X。
Y = -X
Y.plot()
plt.show()
矩#
旧的基础设施提供了一个用于原始矩的 moments 方法。当只指定阶数时,新的 moment 方法是直接的替代。
stats.weibull_min.moment(1, c), X.moment(1) # first raw moment of the Weibull distribution with shape c
(np.float64(0.8862269254527579), np.float64(0.8862269254527579))
然而,旧基础设施还有一个 stats 方法,它提供了分布的各种统计量。以下统计量与指示的字符相关联。
均值(关于原点的第一原始矩,
'm')方差(第二中心矩,
'v')偏度(第三标准化矩,
's')超额峰度(第四标准化矩减去 3,
'k')
例如
stats.weibull_min.stats(c, moments='mvsk')
(np.float64(0.8862269254527579),
 np.float64(0.21460183660255183),
 np.float64(0.6311106578189344),
 np.float64(0.24508930068764556))
现在,可以通过向新的 moment 方法传递适当的参数来计算任何 order 和 kind(原始、中心和标准化)的矩。
(X.moment(order=1, kind='raw'),
 X.moment(order=2, kind='central'),
 X.moment(order=3, kind='standardized'),
 X.moment(order=4, kind='standardized'))
(np.float64(0.8862269254527579),
 np.float64(0.21460183660255183),
 np.float64(0.6311106578189344),
 np.float64(3.2450893006876314))
注意峰度定义的差异。以前提供的是“超额”(又称“费舍尔”)峰度。根据惯例(而非自然的数学定义),这是标准化第四矩减去一个常数值(3),以使正态分布的值为 0.0。
stats.norm.stats(moments='k')
np.float64(0.0)
新的 moment 和 kurtosis 方法默认不遵循此惯例;它们根据数学定义报告标准化第四矩。这也被称为“非超额”(或“皮尔逊”)峰度,对于标准正态分布,其值为 3.0。
stats.Normal().moment(4, kind='standardized')
np.float64(3.0)
为方便起见,kurtosis 方法提供了 convention 参数来选择这两种约定。
stats.Normal().kurtosis(convention='excess'), stats.Normal().kurtosis(convention='non-excess')
(np.float64(0.0), np.float64(3.0))
随机变数#
旧基础设施的 rvs 方法已被 sample 替代,但在以下两种情况下应注意两个差异:1) 需要控制随机状态或 2) 形状、位置或比例参数使用数组。
首先,参数 random_state 被 rng 替换,依据 SPEC 7。过去控制随机状态的模式是使用 numpy.random.seed 或将整数种子传递给 random_state 参数。整数种子被转换为 numpy.random.RandomState 的实例,因此在以下两种情况下,给定整数种子的行为将是相同的
import numpy as np
np.random.seed(1)
dist = stats.norm
dist.rvs(), dist.rvs(random_state=1)
(np.float64(1.6243453636632417), np.float64(1.6243453636632417))
在新的基础设施中,将 numpy.Generator 的实例传递给 sample 的 rng 参数以控制随机状态。请注意,整数种子现在被转换为 numpy.random.Generator 的实例,而不是 numpy.random.RandomState 的实例。
X = stats.Normal()
rng = np.random.default_rng(1)  # instantiate a numpy.random.Generator
X.sample(rng=rng), X.sample(rng=1)
(np.float64(0.345584192064786), np.float64(0.345584192064786))
其次,参数 shape 替换了参数 size。
dist.rvs(size=(3, 4))
array([[-0.61175641, -0.52817175, -1.07296862,  0.86540763],
       [-2.3015387 ,  1.74481176, -0.7612069 ,  0.3190391 ],
       [-0.24937038,  1.46210794, -2.06014071, -0.3224172 ]])
X.sample(shape=(3, 4))
array([[-0.31481026,  0.62016202,  0.30347577,  2.06372074],
       [ 0.269438  ,  0.45327138,  1.52273524,  0.42915731],
       [-0.97010282,  0.33128361, -1.16448709,  0.47495506]])
除了名称上的差异,当涉及数组形状参数时,行为也有所不同。以前,分布参数数组的形状必须包含在 size 中。
dist.rvs(size=(3, 4, 2), loc=[0, 1]).shape # `loc` has shape (2,)
(3, 4, 2)
现在,参数数组的形状被认为是随机变量对象本身的属性。指定数组形状参数的形状将是多余的,因此在指定样本的 shape 时不包括它。
Y = stats.Normal(mu = [0, 1])
Y.sample(shape=(3, 4)).shape  # the sample has shape (3, 4); each element is of shape (2,)
(3, 4, 2)
概率质量(又称“置信”)区间#
旧的基础设施提供了一个 interval 方法,默认情况下,它会返回一个对称(关于中位数)的区间,包含指定百分比的分布概率质量。
a = 0.95
dist.interval(confidence=a)
(np.float64(-1.959963984540054), np.float64(1.959963984540054))
现在,调用逆 CDF 和互补 CDF 方法,并传入每个尾部所需的概率质量。
p = 1 - a
X.icdf(p/2), X.iccdf(p/2)
(np.float64(-1.959963984540054), np.float64(1.959963984540054))
似然函数#
旧基础设施提供了一个函数来计算负对数似然函数,错误地命名为 nnlf (而不是 nllf)。它接受分布参数作为元组,观测值作为数组。
mu = 0
sigma = 1
data = stats.norm.rvs(size=100, loc=mu, scale=sigma)
stats.norm.nnlf((mu, sigma), data)
np.float64(131.07116392314364)
现在,只需根据其数学定义计算负对数似然。
X = stats.Normal(mu=mu, sigma=sigma)
-X.logpdf(data).sum()
np.float64(131.07116392314364)
期望值#
旧基础设施的 expect 方法估计一个由分布 PDF 加权任意函数的定积分。例如,分布的第四矩由以下公式给出
def f(x): return x**4
stats.norm.expect(f, lb=-np.inf, ub=np.inf)
np.float64(3.000000000000001)
这并没有比源代码所做的事情提供更多的便利:使用 scipy.integrate.quad 进行数值积分。
from scipy import integrate
def f(x): return x**4 * stats.norm.pdf(x)
integrate.quad(f, a=-np.inf, b=np.inf)  # integral estimate, estimate of the error
(3.0000000000000053, 1.2043244026618655e-08)
当然,使用新的基础设施也可以轻易做到这一点。
def f(x): return x**4 * X.pdf(x)
integrate.quad(f, a=-np.inf, b=np.inf)  # integral estimate, estimate of the error
(3.0000000000000053, 1.2043244043338238e-08)
conditional 参数只是将结果按区间内包含的概率质量的倒数进行缩放。
a, b = -1, 3
def f(x): return x**4
stats.norm.expect(f, lb=a, ub=b, conditional=True)
np.float64(1.657813862143119)
直接使用 quad,即
def f(x): return x**4 * stats.norm.pdf(x)
prob = stats.norm.cdf(b) - stats.norm.cdf(a)
integrate.quad(f, a=a, b=b)[0] / prob
np.float64(1.6578138621431193)
有了新的随机变量
integrate.quad(f, a=a, b=b)[0] / X.cdf(a, b)
np.float64(1.6578138621431193)
请注意,新随机变量的 cdf 方法接受两个参数来计算指定区间内的概率质量。在许多情况下,这可以避免当概率质量非常小时的减法误差(“灾难性抵消”)。
拟合#
位置/尺度估计#
旧的基础设施提供了一个函数,用于从数据中估计分布的位置和尺度参数。
rng = np.random.default_rng(91392794601852341588152500276639671056)
dist = stats.weibull_min
c, loc, scale = 0.5, 0, 4.
data = dist.rvs(size=100, c=c, loc=loc, scale=scale, random_state=rng)
dist.fit_loc_scale(data, c)
# compare against 0 (default location) and 4 (specified scale)
(np.float64(1.8268432669973347), np.float64(1.9640905288934327))
根据源代码,很容易复制该方法。
X = Weibull(c=c)
def fit_loc_scale(X, data):
    m, v = X.mean(), X.variance()
    m_, v_ = data.mean(), data.var()
    scale = np.sqrt(v_ / v)
    loc = m_ - scale*m
    return loc, scale

fit_loc_scale(X, data)
(np.float64(1.8268432669973347), np.float64(1.9640905288934327))
请注意,在这个例子中,估计值相当差,启发式方法的糟糕性能也是决定不提供替代方案的因素之一。
最大似然估计#
旧基础设施的最后一个方法是 fit,它根据分布的样本估计底层分布的位置、尺度和形状参数。
c_, loc_, scale_ = stats.weibull_min.fit(data)
c_, loc_, scale_
(np.float64(0.5960699537061247),
 np.float64(1.8950104942593064e-05),
 np.float64(4.015875612107546))
这种方法的便利性既是福也是祸。
当它工作时,其简洁性备受赞赏。对于某些分布,参数的最大似然估计(MLE)的解析表达式已经手动编写,对于这些分布,fit 方法相当可靠。
然而,对于大多数分布,拟合是通过负对数似然函数的数值最小化来执行的。这不保证成功——既因为 MLE 的固有局限性,也因为数值优化的现状——在这些情况下,fit 的用户会陷入困境。然而,一点点理解就能大大有助于确保成功,因此在这里我们介绍一个使用新基础设施进行拟合的迷你教程。
首先,请注意 MLE 是将分布拟合到数据的几种潜在策略之一。它所做的只是找到使负对数似然 (NLLF) 最小化的分布参数值。请注意,对于生成数据的分布,NLLF 为
stats.weibull_min.nnlf((c, loc, scale), data)
np.float64(246.9503871545133)
使用 fit 估计的参数的 NLLF 较低
stats.weibull_min.nnlf((c_, loc_, scale_), data)
np.float64(230.35385152369787)
因此,无论这是否满足用户对“良好拟合”的看法,或者参数是否在合理范围内,fit 都认为其任务已完成。除了允许用户为分布参数指定猜测外,它几乎无法控制该过程。(注意:从技术上讲,optimizer 参数可用于更大的控制,但这没有很好的文档,并且其使用抵消了 fit 方法提供的任何便利。)
另一个问题是 MLE 对于某些分布而言本质上行为不佳。例如,在这个例子中,我们可以通过简单地将位置设置为数据的最小值来使 NLLF 尽可能低——即使形状和尺度参数的值是虚假的。
stats.weibull_min.nnlf((0.1, np.min(data), 10), data)
np.float64(-inf)
这些问题还与 fit 默认估计所有分布参数,包括位置这一事实相复合。在上面的例子中,我们可能只对更常见的双参数 Weibull 分布感兴趣,因为实际位置为零。fit 可以通过指定位置是固定参数来适应这一点。
# c_, loc_, scale_ = stats.weibull_min.fit(data, loc=0)  # careful! this provides loc=0 as a *guess*
c_, loc_, scale_ = stats.weibull_min.fit(data, floc=0)
c_, loc_, scale_
(np.float64(0.5834128280886433), 0, np.float64(3.829972848420729))
stats.weibull_min.nnlf((c_, loc_, scale_), data)
np.float64(244.9617429249505)
但是,通过提供一个声称“开箱即用”的 fit 方法,用户被鼓励忽略一些重要的细节。
相反,我们建议使用 SciPy 提供的通用优化工具来拟合分布到数据几乎同样简单。然而,这允许用户根据自己偏好的目标函数执行拟合,在出现预期之外的问题时提供选项,并帮助用户避免最常见的陷阱。
例如,假设我们期望的目标函数确实是负对数似然。将其定义为仅形状参数 c 和尺度参数的函数,并将位置保持为默认值零,这是很简单的。
def nllf(x):
    c, scale = x  # pass (only) `c` and `scale` as elements of `x`
    X = Weibull(c=c) * scale
    return -X.logpdf(data).sum()

nllf((c_, scale_))
np.float64(244.96174292495053)
为了执行最小化,我们可以使用 scipy.optimize.minimize。
from scipy import optimize
eps = 1e-10  # numerical tolerance to avoid invalid parameters
lb = [eps, eps]  # lower bound on `c` and `scale`
ub = [10, 10]  # upper bound on `c` and `scale`
x0 = [1, 1]  # guess to get optimization started
bounds = optimize.Bounds(lb, ub)
res_mle = optimize.minimize(nllf, x0, bounds=bounds)
res_mle
  message: CONVERGENCE: NORM OF PROJECTED GRADIENT <= PGTOL
  success: True
   status: 0
      fun: 244.96174292277675
        x: [ 5.834e-01  3.830e+00]
      nit: 13
      jac: [ 5.684e-06  0.000e+00]
     nfev: 45
     njev: 15
 hess_inv: <2x2 LbfgsInvHessProduct with dtype=float64>
目标函数的值基本相同,PDF 无法区分。
import matplotlib.pyplot as plt
x = np.linspace(eps, 15, 300)

c_, scale_ = res_mle.x
X = Weibull(c=c_)*scale_
plt.plot(x, X.pdf(x), '-', label='numerical optimization')

c_, _, scale_ = stats.weibull_min.fit(data, floc=0)
Y = Weibull(c=c_)*scale_
plt.plot(x, Y.pdf(x), '--', label='`weibull_min.fit`')

plt.hist(data, bins=np.linspace(0, 20, 30), density=True, alpha=0.1)
plt.xlabel('x')
plt.ylabel('pdf(x)')
plt.legend()
plt.ylim(0, 0.5)
plt.show()
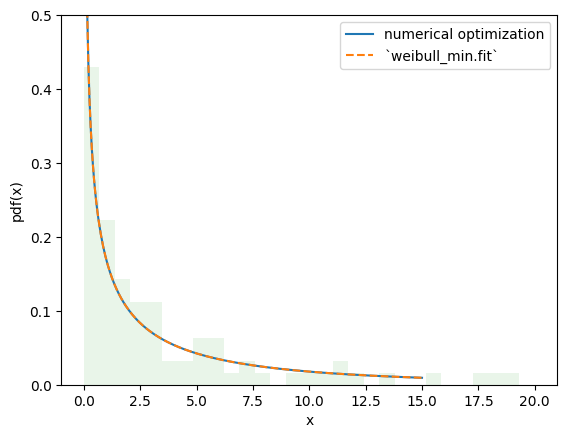
然而,通过这种方法,更改拟合过程以满足我们的需求变得微不足道,从而可以实现rv_continuous.fit 未提供的估计过程。例如,我们可以通过将目标函数更改为以下负对数乘积间隔来执行最大间隔估计 (MSE)。
def nlps(x):
    c, scale = x
    X = Weibull(c=c) * scale
    x = np.sort(np.concatenate((data, X.support())))  # Append the endpoints of the support to the data
    return -X.logcdf(x[:-1], x[1:]).sum().real  # Minimize the sum of the logs the probability mass between points

res_mps = optimize.minimize(nlps, x0, bounds=bounds)
res_mps.x
array([0.5591792 , 3.85552363])
对于L-矩方法(尝试匹配分布和样本 L-矩)
def lmoment_residual(x):
    c, scale = x
    X = Weibull(c=c) * scale
    E11 = stats.order_statistic(X, r=1, n=1).mean()
    E12, E22 = stats.order_statistic(X, r=[1, 2], n=2).mean()
    lmoments_X = [E11, 0.5*(E22 - E12)]  # the first two l-moments of the distribution
    lmoments_x = stats.lmoment(data, order=[1, 2])  # first two l-moments of the data
    return np.linalg.norm(lmoments_x - lmoments_X)  # Minimize the norm of the difference

x0 = [0.4, 3]  # This method is a bit sensitive to the initial guess
res_lmom = optimize.minimize(lmoment_residual, x0, bounds=bounds)
res_lmom.x, res_lmom.fun  # residual should be ~0
(array([0.60943275, 3.90234501]), np.float64(5.041000173121575e-07))
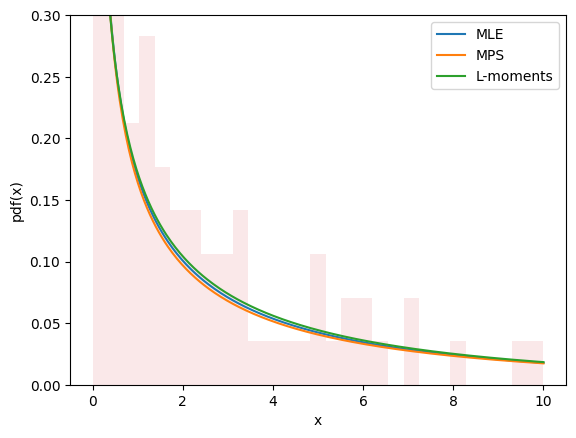
所有三种方法的图看起来都很相似,并且似乎能描述数据,这让我们对拟合效果良好充满信心。
import matplotlib.pyplot as plt
x = np.linspace(eps, 10, 300)

for res, label in [(res_mle, "MLE"), (res_mps, "MPS"), (res_lmom, "L-moments")]:
    c_, scale_ = res.x
    X = Weibull(c=c_)*scale_
    plt.plot(x, X.pdf(x), '-', label=label)

plt.hist(data, bins=np.linspace(0, 10, 30), density=True, alpha=0.1)
plt.xlabel('x')
plt.ylabel('pdf(x)')
plt.legend()
plt.ylim(0, 0.3)
plt.show()
估计并不总是涉及将分布拟合到数据。例如,在 gh-12134 中,用户需要计算 Weibull 分布的形状和尺度参数,以达到给定的均值和标准差。这很容易融入相同的框架。
moments_0 = np.asarray([8, 20])  # desired mean and standard deviation
def f(x):
    c, scale = x
    X = Weibull(c=c) * scale
    moments_X = X.mean(), X.standard_deviation()
    return np.linalg.norm(moments_X - moments_0)

bounds.lb = np.asarray([0.1, 0.1])  # the Weibull distribution is problematic for very small c
res = optimize.minimize(f, x0, bounds=bounds, method='slsqp')  # easily change the minimization method
res
     message: Optimization terminated successfully
     success: True
      status: 0
         fun: 4.594829312984325e-07
           x: [ 4.627e-01  3.430e+00]
         nit: 21
         jac: [ 1.322e+02 -2.330e-01]
        nfev: 100
        njev: 21
 multipliers: []
新功能与高级功能#
变换#
数学变换可以应用于随机变量。例如,随机变量与标量之间的许多基本算术运算(+、-、*、/、**)以及 NumPy 数组都适用。
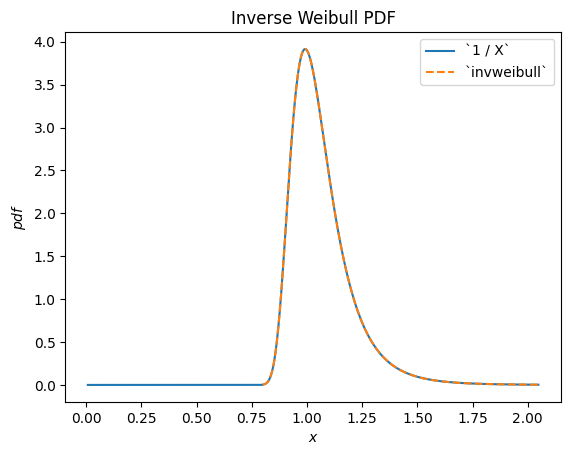
例如,我们可以看到威布尔分布随机变量的倒数服从 scipy.stats.invweibull。("逆"分布通常是随机变量倒数所对应的分布。)
c = 10.6

X = Weibull(c=10.6)
Y = 1 / X  # compare to `invweibull`
Y.plot()

x = np.linspace(0.8, 2.05, 300)
plt.plot(x, stats.invweibull(c=c).pdf(x), '--')
plt.legend(['`1 / X`', '`invweibull`'])
plt.title("Inverse Weibull PDF")
plt.show()
/home/treddy/github_projects/scipy/doc/build/env/lib/python3.11/site-packages/scipy/stats/_distribution_infrastructure.py:1966: RuntimeWarning: divide by zero encountered in divide
  h=lambda u: 1 / u, dh=lambda u: 1 / u ** 2)
/home/treddy/github_projects/scipy/doc/build/env/lib/python3.11/site-packages/scipy/stats/_continuous_distns.py:2747: RuntimeWarning: invalid value encountered in multiply
  return c*pow(x, c-1)*np.exp(-pow(x, c))
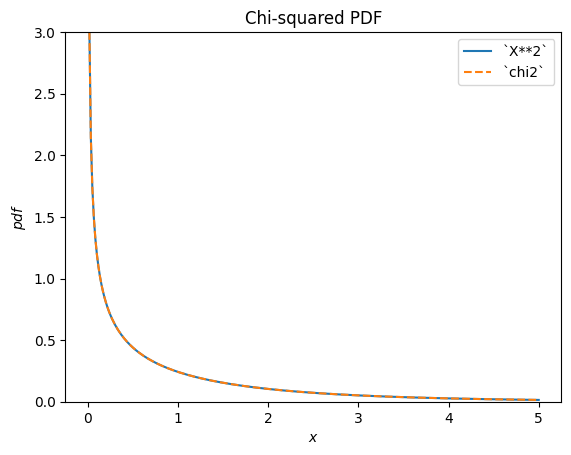
scipy.stats.chi2 描述了正态分布随机变量的平方和。
X = stats.Normal()
Y = X**2  # compare to chi2
Y.plot(t=('x', eps, 5));

x = np.linspace(eps, 5, 300)
plt.plot(x, stats.chi2(df=1).pdf(x), '--')
plt.ylim(0, 3)
plt.legend(['`X**2`', '`chi2`'])
plt.title("Chi-squared PDF")
plt.show()
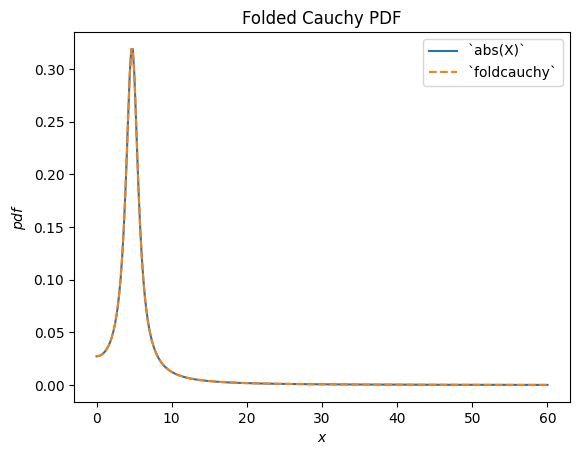
scipy.stats.foldcauchy 描述了柯西分布随机变量的绝对值。(“折叠”分布是随机变量绝对值所对应的分布。)
Cauchy = stats.make_distribution(stats.cauchy)
c = 4.72

X = Cauchy() + c
Y = abs(X)  # compare to `foldcauchy`
Y.plot(t=('x', 0, 60))

x = np.linspace(0, 60, 300)
plt.plot(x, stats.foldcauchy(c=c).pdf(x), '--')
plt.legend(['`abs(X)`', '`foldcauchy`'])
plt.title("Folded Cauchy PDF")
plt.show()
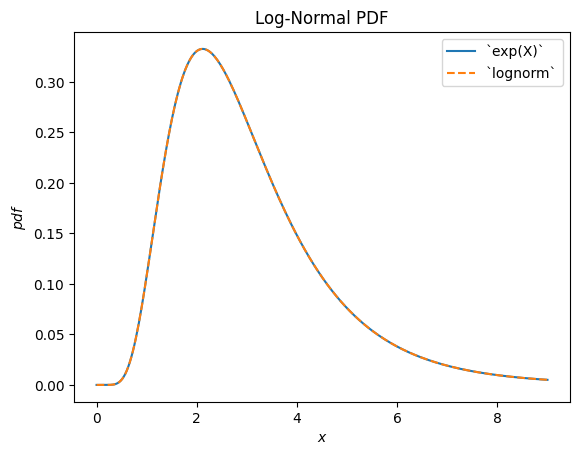
scipy.stats.lognormal 描述了正态分布随机变量的指数。之所以这样命名,是因为所得随机变量的对数是正态分布的。(通常,"对数"分布通常是随机变量指数所对应的分布。)
u, s = 1, 0.5

X = stats.Normal()*s + u
Y = stats.exp(X)  # compare to `lognorm`
Y.plot(t=('x', eps, 9))

x = np.linspace(eps, 9, 300)
plt.plot(x, stats.lognorm(s=s, scale=np.exp(u)).pdf(x), '--')
plt.legend(['`exp(X)`', '`lognorm`'])
plt.title("Log-Normal PDF")
plt.show()
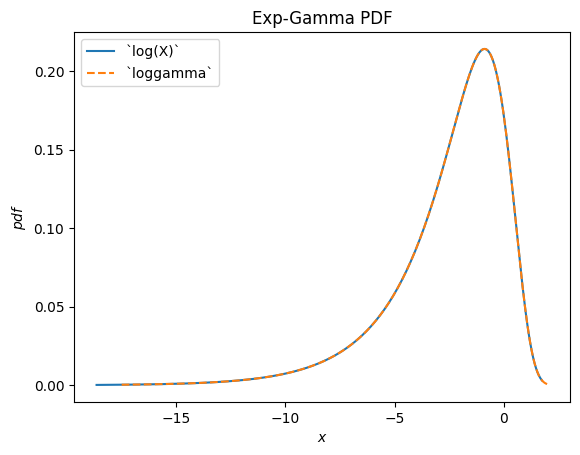
scipy.stats.loggamma 描述了伽马分布随机变量的对数。请注意,根据惯例,此分布的适当名称应为指数伽马,因为该随机变量的指数服从伽马分布。
Gamma = stats.make_distribution(stats.gamma)
a = 0.414

X = Gamma(a=a)
Y = stats.log(X)  # compare to `loggamma`
Y.plot()

x = np.linspace(-17.5, 2, 300)
plt.plot(x, stats.loggamma(c=a).pdf(x), '--')
plt.legend(['`log(X)`', '`loggamma`'])
plt.title("Exp-Gamma PDF")
plt.show()
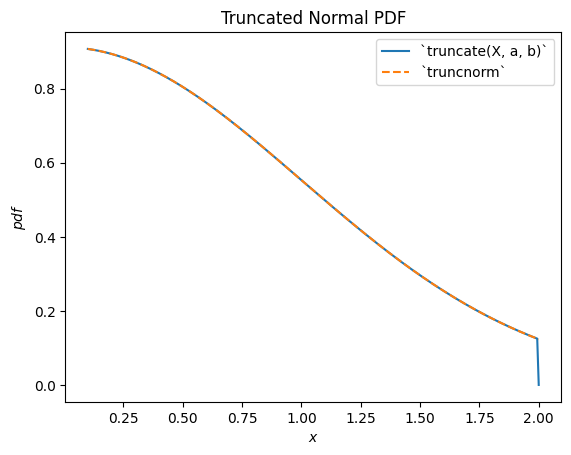
scipy.stats.truncnorm 是截断正态随机变量的基础分布。请注意,截断变换可以在正态分布随机变量平移和缩放之前或之后应用,这比 scipy.stats.truncnorm(其本质上在截断之后进行平移和缩放)更容易实现所需结果。
a, b = 0.1, 2

X = stats.Normal()
Y = stats.truncate(X, a, b)  # compare to `truncnorm`
Y.plot()

x = np.linspace(a, b, 300)
plt.plot(x, stats.truncnorm(a, b).pdf(x), '--')
plt.legend(['`truncate(X, a, b)`', '`truncnorm`'])
plt.title("Truncated Normal PDF")
plt.show()
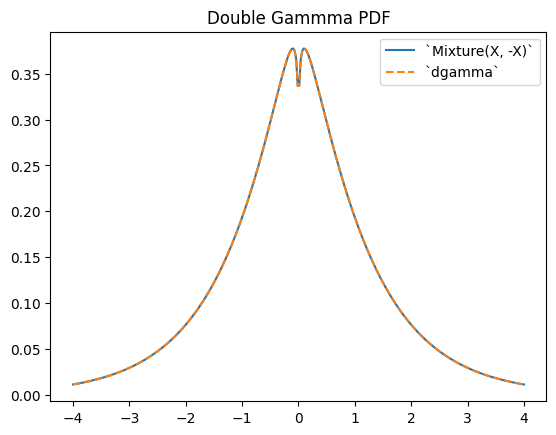
scipy.stats.dgamma 是两个伽马分布随机变量的混合,其中一个关于原点反射。(通常,“双”分布是随机变量混合的基础分布,其中一个被反射。)
a = 1.1
X = Gamma(a=a)
Y = stats.Mixture((X, -X), weights=[0.5, 0.5])
# plot method not available for mixtures

x = np.linspace(-4, 4, 300)
plt.plot(x, Y.pdf(x))
plt.plot(x, stats.dgamma(a=a).pdf(x), '--')
plt.legend(['`Mixture(X, -X)`', '`dgamma`'])
plt.title("Double Gammma PDF")
plt.show()
限制#
虽然支持随机变量与 Python 标量或 NumPy 数组之间的大多数算术变换,但仍存在一些限制。
将随机变量提升到某个参数的幂次仅在参数为正整数时实现。
将一个参数提升到随机变量的幂次仅在参数为非 1 的正标量时实现。
除以随机变量仅在支持范围完全非负或非正时实现。
随机变量的对数仅在支持非负时实现。(负值的对数是虚数。)
两个随机变量之间的算术运算尚未支持。请注意,此类运算在数学上要复杂得多;例如,两个随机变量之和的 PDF 涉及两个 PDF 的卷积。
此外,虽然转换是可组合的,但 a) 截断和 b) 平移/缩放都只能进行一次。例如,Y = 2 * stats.exp(X + 1) 将会引发错误,因为这需要在指数化之前进行平移,并在指数化之后进行缩放;这被视为“平移/缩放”两次。然而,这里(以及许多情况下)可以通过数学简化来避免问题:Y = (2*math.exp(2)) * stats.exp(X) 是等价的,并且只需要一次缩放操作。
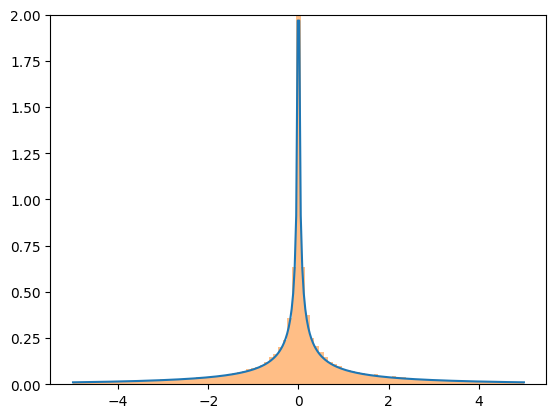
尽管这些变换相当稳健,但它们都依赖于通用的实现,这可能会导致数值困难。如果您担心变换结果的准确性,请考虑将所得 PDF 与随机样本的直方图进行比较。
X = stats.Normal()
Y = X**3
x = np.linspace(-5, 5, 300)
plt.plot(x, Y.pdf(x), label='pdf')
plt.hist(X.sample(100000)**3, density=True, bins=np.linspace(-5, 5, 100), alpha=0.5);
plt.ylim(0, 2)
plt.show()
准蒙特卡洛采样#
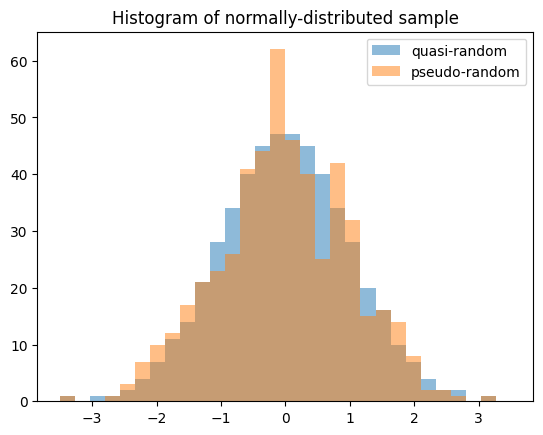
随机变量支持从统计分布生成准随机、低差异样本。
import numpy as np
import matplotlib.pyplot as plt
from scipy import stats
X = stats.Normal()

rng = np.random.default_rng(7824387278234)
qrng = stats.qmc.Sobol(1, rng=rng)  # instantiate a QMCEngine

bins = np.linspace(-3.5, 3.5, 31)
plt.hist(X.sample(512, rng=qrng), bins, alpha=0.5, label='quasi-random')
plt.hist(X.sample(512, rng=rng), bins, alpha=0.5, label='pseudo-random')
plt.title('Histogram of normally-distributed sample')
plt.legend()
plt.show()
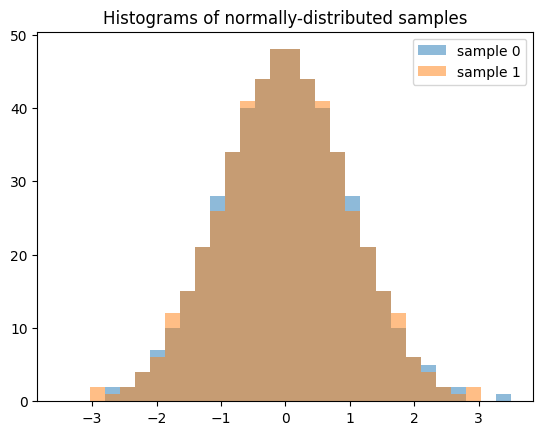
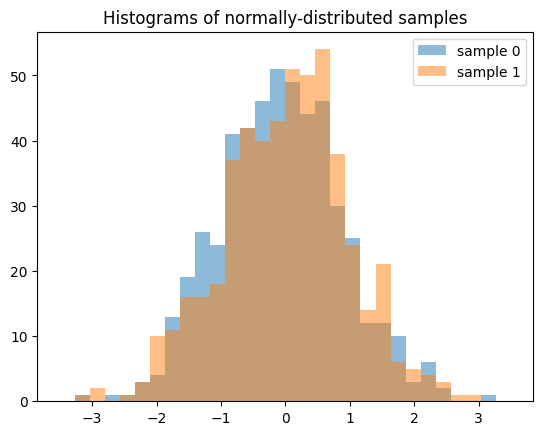
请注意,在生成多个样本(例如 len(shape) > 1)时,沿零轴的每个切片都是一个独立的、低差异序列。以下生成两个独立的 QMC 样本,每个长度为 512。
samples = X.sample((512, 2), rng=qrng)
plt.hist(samples[:, 0], bins, alpha=0.5, label='sample 0')
plt.hist(samples[:, 1], bins, alpha=0.5, label='sample 1')
plt.title('Histograms of normally-distributed samples')
plt.legend()
plt.show()
如果我们生成 512 个独立的 QMC 序列,每个长度为 2,结果将大不相同。
samples = X.sample((2, 512), rng=qrng)
plt.hist(samples[0], bins, alpha=0.5, label='sample 0')
plt.hist(samples[1], bins, alpha=0.5, label='sample 1')
plt.title('Histograms of normally-distributed samples')
plt.legend()
plt.show()
准确性#
对于某些分布,如 scipy.stats.norm,几乎所有分布的方法都经过定制,以确保精确计算。对于其他分布,如 scipy.stats.gausshyper,除了 PDF 之外几乎没有定义其他方法,其他方法必须根据 PDF 进行数值计算。例如,高斯超几何分布的生存函数(互补 CDF)是通过对 PDF 从 0(支持的左端)到 x 进行数值积分以获得 CDF,然后取补数来计算的。
a, b, c, z = 1.5, 2.5, 2, 0
x = 0.5
frozen = stats.gausshyper(a=a, b=b, c=c, z=z)
frozen.sf(x)
np.float64(0.28779340921080643)
frozen.sf(x) == 1 - integrate.quad(frozen.pdf, 0, x)[0]
np.True_
然而,另一种方法是将 PDF 从 x 到 1(支持的右端)进行数值积分。
integrate.quad(frozen.pdf, x, 1)[0]
0.28779340919669805
这些方法虽然不同但同样有效,因此假设 PDF 准确,那么两种结果以相同方式不准确的可能性很小。因此,我们可以通过比较它们来估计结果的准确性。
res1 = frozen.sf(x)
res2 = integrate.quad(frozen.pdf, x, 1)[0]
abs((res1 - res2) / res1)
np.float64(4.902259981810363e-11)
新基础设施知道计算大多数数量的几种不同方式。例如,此图表说明了各种分布函数之间的关系。
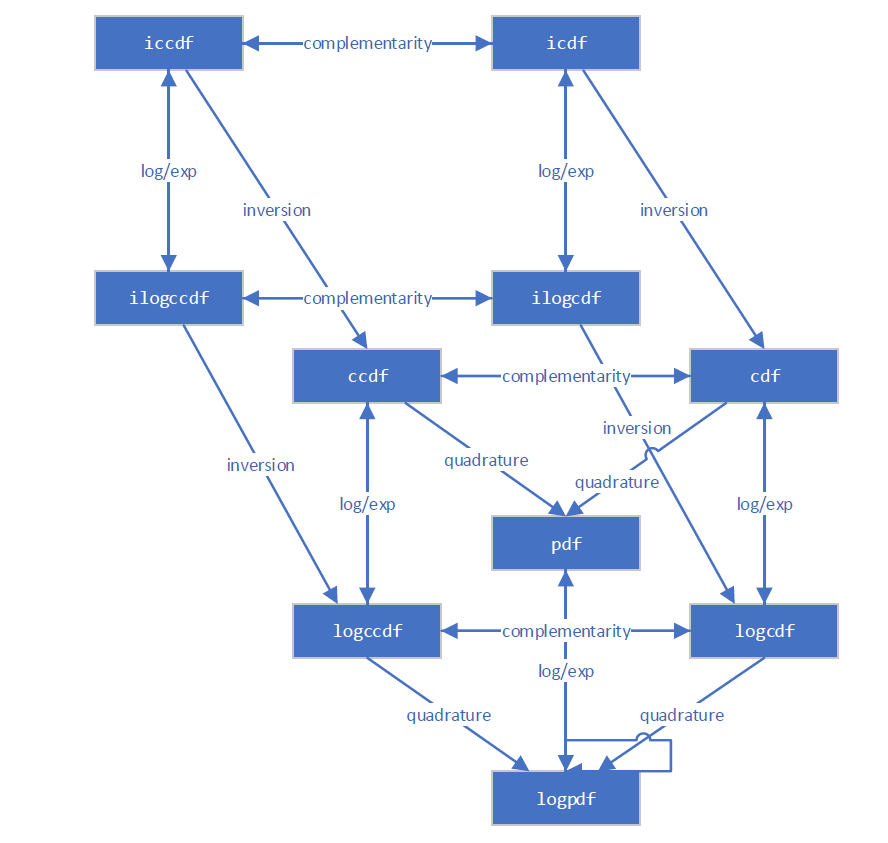
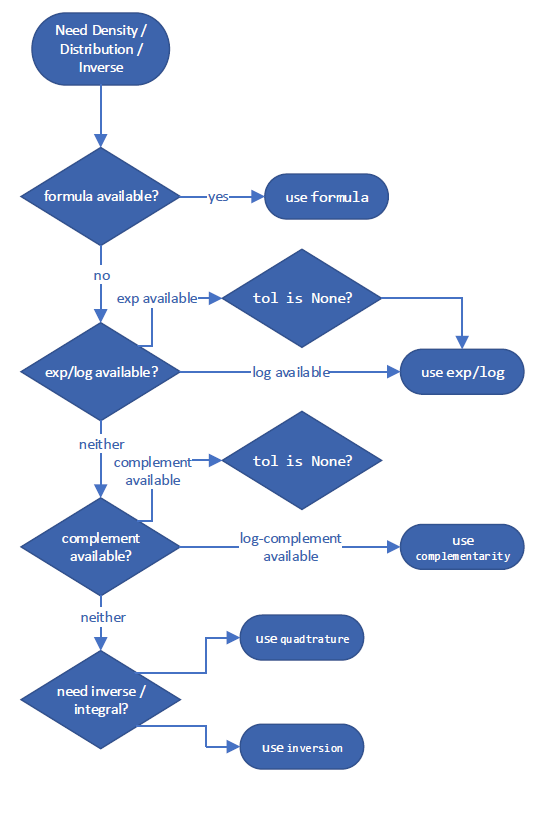
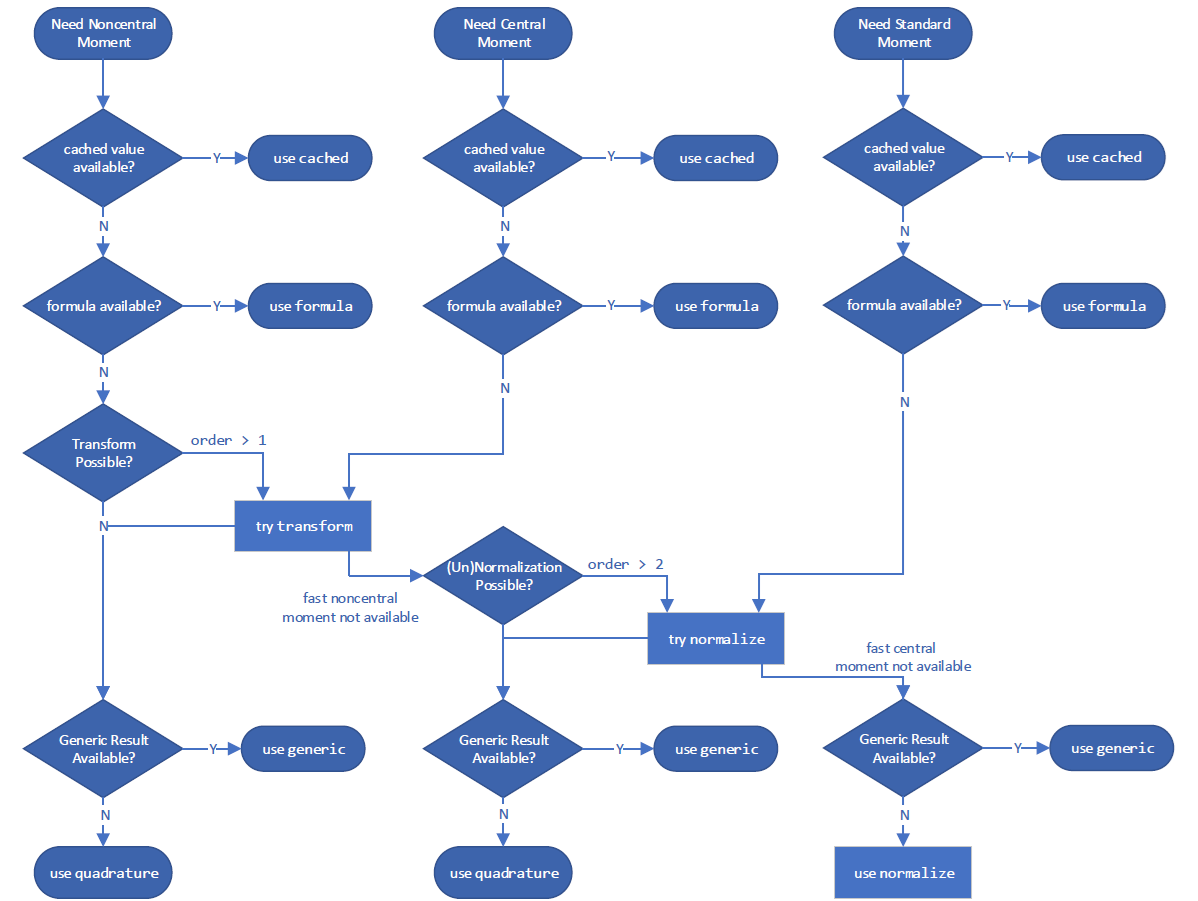
它遵循决策树来选择预计最准确的量估算方法。这些针对“最佳”方法的具体决策树可能会在 SciPy 版本之间发生变化,但计算互补 CDF 的示例如下所示
以及计算一个矩
然而,您可以使用 method 参数覆盖其使用的方法。
GaussHyper = stats.make_distribution(stats.gausshyper)
X = GaussHyper(a=a, b=b, c=c, z=z)
对于 ccdf,method='quadrature' 在右尾对 PDF 进行积分。
X.ccdf(x, method='quadrature') == integrate.tanhsinh(X.pdf, x, 1).integral
np.True_
method='complement' 取 CDF 的补数。
X.ccdf(x, method='complement') == (1 - integrate.tanhsinh(X.pdf, 0, x).integral)
np.True_
method='logexp' 取 CCDF 对数的指数。
X.ccdf(x, method='logexp') == np.exp(integrate.tanhsinh(lambda x: X.logpdf(x), x, 1, log=True).integral)
np.True_
如有疑问,请尝试不同的 method 来计算给定的量。
性能#
考虑涉及高斯超几何分布的计算性能。对于标量形状和参数,新旧基础设施的性能相当。新基础设施预计不会快很多;尽管它减少了参数验证的“开销”,但其在标量数量的数值积分方面并没有显著加快,而后者在此处占据了执行时间的主导地位。
%timeit X.cdf(x) # new infrastructure
439 μs ± 26.2 μs per loop (mean ± std. dev. of 7 runs, 1,000 loops each)
%timeit stats.gausshyper.cdf(x, a, b, c, z) # old infrastructure
346 μs ± 1.3 μs per loop (mean ± std. dev. of 7 runs, 1,000 loops each)
np.isclose(X.cdf(x), stats.gausshyper.cdf(x, a, b, c, z))
np.True_
但当涉及到数组时,新基础设施的速度要快得多。这是因为为新基础设施开发的底层积分器(scipy.integrate.tanhsinh)和求根器(scipy.optimize.elementwise.find_root)是原生向量化的,而旧基础设施使用的旧例程(scipy.integrate.quad 和 scipy.optimize.brentq)则不是。
x = np.linspace(0, 1, 1000)
%timeit X.cdf(x) # new infrastructure
2.36 ms ± 1.25 μs per loop (mean ± std. dev. of 7 runs, 100 loops each)
%timeit stats.gausshyper.cdf(x, a, b, c, z) # old infrastructure
303 ms ± 70 μs per loop (mean ± std. dev. of 7 runs, 1 loop each)
只要底层函数通过数值积分或求逆(求根)计算,数组计算就可以预期有类似的性能改进。
可视化#
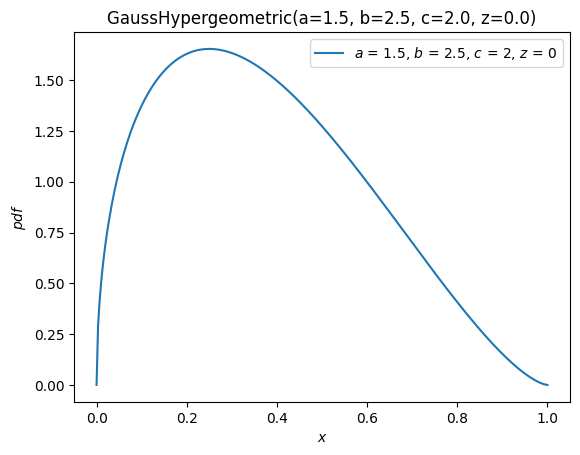
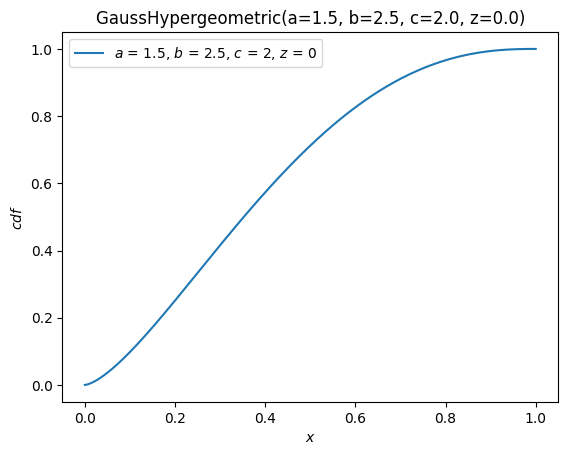
我们可以使用方便的方法 plot,轻松地可视化随机变量所对应的分布函数。
import matplotlib.pyplot as plt
ax = X.plot()
plt.show()
X.plot(y='cdf')
plt.show()
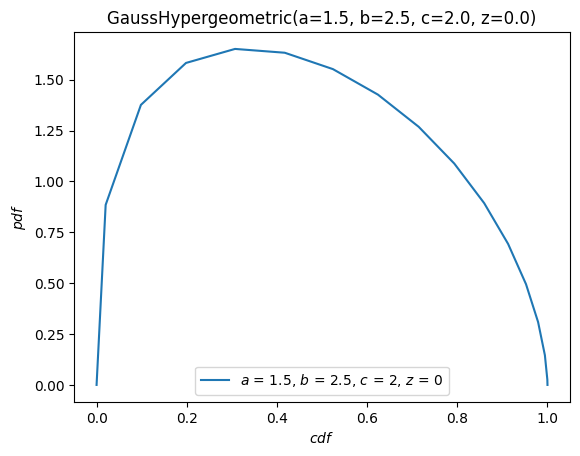
plot 方法非常灵活,其签名灵感来自图形的语法。例如,当参数 \(x\) 在 \([-10, 10]\) 上时,绘制 PDF 与 CDF 的对比图。
X.plot('cdf', 'pdf', t=('x', -10, 10))
plt.show()
顺序统计量#
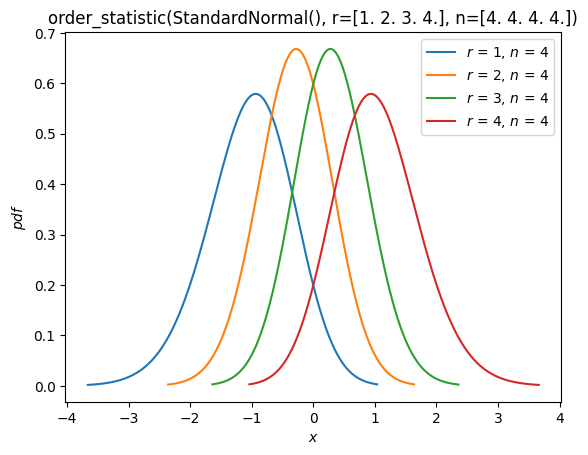
如上文“拟合”部分所示,现在支持从分布中抽取随机样本的顺序统计量的分布。例如,我们可以绘制样本量为 4 的正态分布顺序统计量的概率密度函数。
n = 4
r = np.arange(1, n+1)
X = stats.Normal()
Y = stats.order_statistic(X, r=r, n=n)
Y.plot()
plt.show()
计算这些顺序统计量的期望值
Y.mean()
array([-1.02937537, -0.29701138, 0.29701138, 1.02937537])
结论#
尽管改变可能令人不适,但新的基础设施为 SciPy 概率分布的用户提供了更好的体验。当然,它还未完成!在编写本指南时,以下功能计划在未来版本中发布
附加的内置分布(除了
Normal和Uniform)离散分布
圆形分布,包括将任意连续分布环绕到圆上的能力
支持 NumPy 以外的其他 Python Array API 兼容后端(例如 CuPy、PyTorch、JAX)
一如既往,SciPy 的开发是由 SciPy 社区为 SciPy 社区完成的。我们始终欢迎对其他功能的建议和实施方面的帮助。
我们希望本指南能激励您尝试新的基础设施并简化该过程。