多元数据在规则网格上的插值 (RegularGridInterpolator)#
假设您有一个规则网格上的 N 维数据,并且想要对其进行插值。在这种情况下,RegularGridInterpolator 会很有用。支持多种插值策略:最近邻插值、线性插值和奇数次张量积样条插值。
严格来说,此类高效处理在直线网格上给定的数据:超立方晶格,点之间可能间距不相等。不同维度上的每维点数可以不同。
以下示例演示了其用法,并比较了使用每种方法得到的插值结果。
>>> import numpy as np
>>> import matplotlib.pyplot as plt
>>> from scipy.interpolate import RegularGridInterpolator
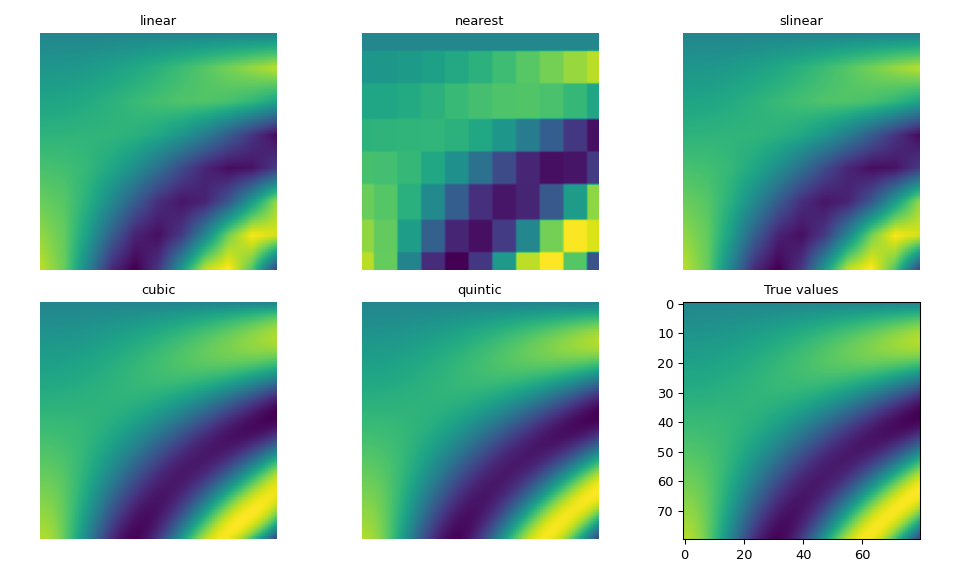
假设我们要对这个二维函数进行插值。
>>> def F(u, v):
...     return u * np.cos(u * v) + v * np.sin(u * v)
假设我们只知道规则网格上的一些数据。
>>> fit_points = [np.linspace(0, 3, 8), np.linspace(0, 3, 11)]
>>> values = F(*np.meshgrid(*fit_points, indexing='ij'))
创建用于评估的测试点和真实值。
>>> ut, vt = np.meshgrid(np.linspace(0, 3, 80), np.linspace(0, 3, 80), indexing='ij')
>>> true_values = F(ut, vt)
>>> test_points = np.array([ut.ravel(), vt.ravel()]).T
我们可以创建插值器,并使用每种方法对测试点进行插值。
>>> interp = RegularGridInterpolator(fit_points, values)
>>> fig, axes = plt.subplots(2, 3, figsize=(10, 6))
>>> axes = axes.ravel()
>>> fig_index = 0
>>> for method in ['linear', 'nearest', 'slinear', 'cubic', 'quintic']:
...     im = interp(test_points, method=method).reshape(80, 80)
...     axes[fig_index].imshow(im)
...     axes[fig_index].set_title(method)
...     axes[fig_index].axis("off")
...     fig_index += 1
>>> axes[fig_index].imshow(true_values)
>>> axes[fig_index].set_title("True values")
>>> fig.tight_layout()
>>> fig.show()
正如预期,高次样条插值最接近真实值,尽管它们的计算成本比 linear 或 nearest 更高。slinear 插值也与 linear 插值匹配。
如果您的数据使得样条方法产生振铃(ringing)效应,您可以考虑使用 method="pchip",它使用 PCHIP 插值器的张量积,即每个维度一个 PchipInterpolator。
如果您倾向于使用函数式接口而不是显式创建类实例,则 interpn 便捷函数提供了等效的功能。
具体来说,这两种形式给出相同的结果
>>> from scipy.interpolate import interpn
>>> rgi = RegularGridInterpolator(fit_points, values)
>>> result_rgi = rgi(test_points)
和
>>> result_interpn = interpn(fit_points, values, test_points)
>>> np.allclose(result_rgi, result_interpn, atol=1e-15)
True
对于局限于 N 维空间的 (N-1) 维子空间的数据,即当某个网格轴的长度为 1 时,沿该轴的外推由 fill_value 关键字参数控制。
>>> x = np.array([0, 5, 10])
>>> y = np.array([0])
>>> data = np.array([[0], [5], [10]])
>>> rgi = RegularGridInterpolator((x, y), data,
...                               bounds_error=False, fill_value=None)
>>> rgi([(2, 0), (2, 1), (2, -1)])   # extrapolates the value on the axis
array([2., 2., 2.])
>>> rgi.fill_value = -101
>>> rgi([(2, 0), (2, 1), (2, -1)])
array([2., -101., -101.])
注意
如果输入数据的维度单位不匹配,且量级相差很大,插值结果可能会出现数值误差。请考虑在插值之前重新缩放数据。
values 的批处理维度#
假设您有一个向量函数 \(f(x) = y\),其中 \(x\) 和 \(y\) 是向量,可能长度不同,并且您想在 \(x\) 值的网格上采样该函数。解决此问题的一种方法是利用 RegularGridInterpolator 允许 values 具有尾随维度的事实。
根据 一维插值器如何解释多维数组,其解释是 values 数组的前 \(N\) 个维度是数据维度(即它们对应于由 grid 参数定义的点),而尾随维度是批处理轴。请注意,这与通常的 NumPy 广播约定不一致,后者沿前导维度进行广播。
举例说明
>>> n = 5 # the number of batch components
>>> # make a 3D grid
>>> x1 = np.linspace(-np.pi, np.pi, 10)
>>> x2 = np.linspace(0.0, np.pi, 15)
>>> x3 = np.linspace(0.0, np.pi/2, 20)
>>> points = (x1, x2, x3)
>>>
>>> # define a function and sample it on the grid
>>> def f(x1, x2, x3, n):
...     lst = [np.sin(np.pi*x1/2) * np.exp(x2/2) + x3 + i for i in range(n)]
...     return np.asarray(lst)
>>>
>>> X1, X2, X3 = np.meshgrid(x1, x2, x3, indexing="ij")
>>> values = f(X1, X2, X3, n)
>>> values.shape
(5, 10, 15, 20)
>>>
>>> # prepare the data and construct the interpolator
>>> values = np.moveaxis(values, 0, -1)
>>> values.shape
(10, 15, 20, 5)     # the batch dimension is 5
>>> rgi = RegularGridInterpolator(points, values)
>>>
>>> # Coordinates to compute the interpolation at
>>> x = np.asarray([0.2, np.pi/2.1, np.pi/4.1])
>>>
# evaluate
>>> rgi(x).shape
(1, 5)
在此示例中,我们在三维网格上评估了一批 \(n=5\) 个函数。通常,允许存在多个批处理维度,结果的形状通过将批处理形状(在此示例中为 (5,))附加到输入 x 的形状(在此示例中为 (1,)`)而得出。
均匀间隔数据#
如果您正在处理具有整数坐标的笛卡尔网格上的数据(例如,图像重采样数据),这些例程可能不是最佳选择。请考虑改用 scipy.ndimage.map_coordinates。
对于等间距网格上的浮点数据,map_coordinates 可以很容易地封装成一个类似于 RegularGridInterpolator 的形式。以下是源自 Johannes Buchner 的“regulargrid”包 的一个基本示例。
class CartesianGridInterpolator:
    def __init__(self, points, values, method='linear'):
        self.limits = np.array([[min(x), max(x)] for x in points])
        self.values = np.asarray(values, dtype=float)
        self.order = {'linear': 1, 'cubic': 3, 'quintic': 5}[method]

    def __call__(self, xi):
        """
        `xi` here is an array-like (an array or a list) of points.

        Each "point" is an ndim-dimensional array_like, representing
        the coordinates of a point in ndim-dimensional space.
        """
        # transpose the xi array into the ``map_coordinates`` convention
        # which takes coordinates of a point along columns of a 2D array.
        xi = np.asarray(xi).T

        # convert from data coordinates to pixel coordinates
        ns = self.values.shape
        coords = [(n-1)*(val - lo) / (hi - lo)
                  for val, n, (lo, hi) in zip(xi, ns, self.limits)]

        # interpolate
        return map_coordinates(self.values, coords,
                               order=self.order,
                               cval=np.nan)  # fill_value
此包装器可用作 RegularGridInterpolator 的(几乎)即插即用替代品。
>>> x, y = np.arange(5), np.arange(6)
>>> xx, yy = np.meshgrid(x, y, indexing='ij')
>>> values = xx**3 + yy**3
>>> rgi = RegularGridInterpolator((x, y), values, method='linear')
>>> rgi([[1.5, 1.5], [3.5, 2.6]])
array([ 9. , 64.9])
>>> cgi = CartesianGridInterpolator((x, y), values, method='linear')
>>> cgi([[1.5, 1.5], [3.5, 2.6]])
array([ 9. , 64.9])
请注意,上述示例使用了 map_coordinates 的边界条件。因此,cubic 和 quintic 插值的结果可能与 RegularGridInterpolator 的结果不同。有关边界条件和其他附加参数的更多详细信息,请参阅 scipy.ndimage.map_coordinates 文档。最后,我们注意到这个简化示例假设输入数据按升序给出。