spline_filter1d#
- scipy.ndimage.spline_filter1d(input, order=3, axis=-1, output=<class 'numpy.float64'>, mode='mirror')[源]#
沿给定轴计算一维样条滤波器。
沿给定轴的数组行通过样条滤波器进行滤波。样条的阶数必须 >= 2 且 <= 5。
- 参数:
- inputarray_like
输入数组。
- orderint, optional
样条的阶数,默认为 3。
- axisint, optional
应用样条滤波器的轴。默认为最后一个轴。
- outputndarray or dtype, optional
放置输出的数组,或返回数组的数据类型。默认为
numpy.float64。- mode{‘reflect’, ‘grid-mirror’, ‘constant’, ‘grid-constant’, ‘nearest’, ‘mirror’, ‘grid-wrap’, ‘wrap’}, optional
mode 参数决定了输入数组如何在其边界之外进行扩展。默认为 'mirror'。每个有效值的行为如下(请参阅边界模式的附加图和详细信息)
- ‘reflect’ (d c b a | a b c d | d c b a)
通过围绕最后一个像素的边缘反射来扩展输入。此模式有时也称为半样本对称。
- ‘grid-mirror’
这是 'reflect' 的同义词。
- ‘constant’ (k k k k | a b c d | k k k k)
通过使用由 cval 参数定义的相同常量值填充边缘之外的所有值来扩展输入。在输入边缘之外不执行插值。
- ‘grid-constant’ (k k k k | a b c d | k k k k)
通过使用由 cval 参数定义的相同常量值填充边缘之外的所有值来扩展输入。对于超出输入范围的样本也会发生插值。
- ‘nearest’ (a a a a | a b c d | d d d d)
通过复制最后一个像素来扩展输入。
- ‘mirror’ (d c b | a b c d | c b a)
通过围绕最后一个像素的中心反射来扩展输入。此模式有时也称为全样本对称。
- ‘grid-wrap’ (a b c d | a b c d | a b c d)
通过环绕到对面边缘来扩展输入。
- ‘wrap’ (d b c d | a b c d | b c a b)
通过环绕到对面边缘来扩展输入,但方式是使最后一个点和初始点完全重叠。在这种情况下,重叠点将选择哪个样本没有明确定义。
- 返回:
- spline_filter1dndarray
滤波后的输入。
另请参阅
spline_filter多维样条滤波器。
注意
ndimage 中的所有插值函数都对输入图像执行样条插值。如果使用 order > 1 的 B 样条,则必须首先将输入图像值转换为 B 样条系数,这通过沿输入的所有轴顺序应用此一维滤波器来完成。所有需要 B 样条系数的函数都将自动过滤其输入,此行为可通过 prefilter 关键字参数控制。对于接受 mode 参数的函数,只有当结果与滤波时使用的 mode 匹配时,结果才是正确的。
对于复数值 input,此函数独立处理实部和虚部。
在 1.6.0 版中新增: 增加了复数值支持。
示例
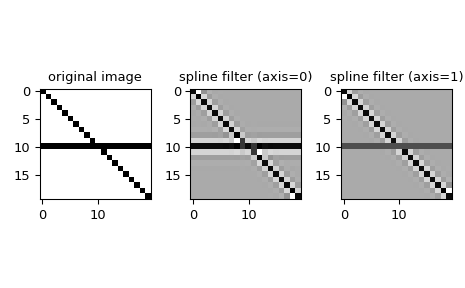
我们可以沿给定轴使用一维样条滤波图像
>>> from scipy.ndimage import spline_filter1d
>>> import numpy as np
>>> import matplotlib.pyplot as plt
>>> orig_img = np.eye(20)  # create an image
>>> orig_img[10, :] = 1.0
>>> sp_filter_axis_0 = spline_filter1d(orig_img, axis=0)
>>> sp_filter_axis_1 = spline_filter1d(orig_img, axis=1)
>>> f, ax = plt.subplots(1, 3, sharex=True)
>>> for ind, data in enumerate([[orig_img, "original image"],
...             [sp_filter_axis_0, "spline filter (axis=0)"],
...             [sp_filter_axis_1, "spline filter (axis=1)"]]):
...     ax[ind].imshow(data[0], cmap='gray_r')
...     ax[ind].set_title(data[1])
>>> plt.tight_layout()
>>> plt.show()
