scipy.ndimage.
gaussian_laplace#
- scipy.ndimage.gaussian_laplace(input, sigma, output=None, mode='reflect', cval=0.0, *, axes=None, **kwargs)[源代码]#
使用高斯二阶导数的多维拉普拉斯滤波。
- 参数:
- input类数组
输入数组。
- sigma标量或标量序列
高斯滤波器的标准差。可为每个轴提供一个序列,或一个单一数字,此时所有轴的标准差均相等。
- output数组或 dtype,可选
用于放置输出的数组,或返回数组的 dtype。默认情况下,将创建一个与输入具有相同 dtype 的数组。
- mode字符串或序列,可选
mode 参数决定了当滤波器与边界重叠时,输入数组如何进行扩展。通过传入一个与输入数组维度数量相等的模式序列,可以沿每个轴指定不同的模式。默认值为 ‘reflect’。有效值及其行为如下:
- ‘reflect’ (d c b a | a b c d | d c b a)
通过围绕最后一个像素的边缘进行反射来扩展输入。此模式有时也称为半样本对称。
- ‘constant’ (k k k k | a b c d | k k k k)
通过用相同的常数值填充超出边缘的所有值来扩展输入,该常数值由 cval 参数定义。
- ‘nearest’ (a a a a | a b c d | d d d d)
通过复制最后一个像素来扩展输入。
- ‘mirror’ (d c b | a b c d | c b a)
通过围绕最后一个像素的中心进行反射来扩展输入。此模式有时也称为全样本对称。
- ‘wrap’ (a b c d | a b c d | a b c d)
通过环绕到对边来扩展输入。
为了与插值函数保持一致,也可以使用以下模式名称:
- ‘grid-constant’
这是 ‘constant’ 的同义词。
- ‘grid-mirror’
这是 ‘reflect’ 的同义词。
- ‘grid-wrap’
这是 ‘wrap’ 的同义词。
- cval标量,可选
如果 mode 为 ‘constant’,则用于填充输入超出边缘的值。默认值为 0.0。
- axes整数元组或 None
应用滤波器的轴。如果提供了 sigma 或 mode 元组,它们的长度必须与轴的数量匹配。
- 额外的关键字参数将传递给 gaussian_filter()。
- 返回:
- gaussian_laplacendarray
滤波后的数组。形状与 input 相同。
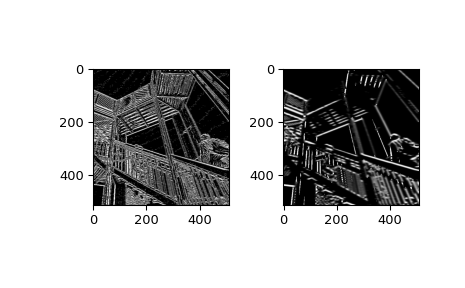
示例
>>> from scipy import ndimage, datasets
>>> import matplotlib.pyplot as plt
>>> ascent = datasets.ascent()
>>> fig = plt.figure()
>>> plt.gray()  # show the filtered result in grayscale
>>> ax1 = fig.add_subplot(121)  # left side
>>> ax2 = fig.add_subplot(122)  # right side
>>> result = ndimage.gaussian_laplace(ascent, sigma=1)
>>> ax1.imshow(result)
>>> result = ndimage.gaussian_laplace(ascent, sigma=3)
>>> ax2.imshow(result)
>>> plt.show()
