scipy.ndimage.
gaussian_filter1d#
- scipy.ndimage.gaussian_filter1d(input, sigma, axis=-1, order=0, output=None, mode='reflect', cval=0.0, truncate=4.0, *, radius=None)[source]#
一维高斯滤波。
- 参数:
- input数组类型
输入数组。
- sigma标量
高斯核的标准差
- axis整数,可选
用于计算的 input 轴。默认为 -1。
- order整数,可选
阶数为 0 对应于与高斯核的卷积。正阶数对应于与高斯导数的卷积。
- output数组或数据类型,可选
用于放置输出的数组,或返回数组的数据类型。默认情况下,将创建与输入具有相同数据类型的数组。
- mode{'reflect'(反射), 'constant'(常量), 'nearest'(最近邻), 'mirror'(镜像), 'wrap'(环绕)},可选
mode 参数决定了输入数组如何在其边界之外进行扩展。默认为“reflect”。每个有效值的行为如下:
- ‘reflect’(反射) (d c b a | a b c d | d c b a)
输入通过最后像素的边缘反射进行扩展。此模式有时也称为半采样对称。
- ‘constant’(常量) (k k k k | a b c d | k k k k)
输入通过将边缘之外的所有值填充为相同的常量值(由 cval 参数定义)进行扩展。
- ‘nearest’(最近邻) (a a a a | a b c d | d d d d)
输入通过复制最后一个像素进行扩展。
- ‘mirror’(镜像) (d c b | a b c d | c b a)
输入通过最后像素的中心反射进行扩展。此模式有时也称为全采样对称。
- ‘wrap’(环绕) (a b c d | a b c d | a b c d)
输入通过环绕到对侧边缘进行扩展。
为了与插值函数保持一致,也可以使用以下模式名称:
- ‘grid-mirror’
这是“reflect”的同义词。
- ‘grid-constant’
这是“constant”的同义词。
- ‘grid-wrap’
这是“wrap”的同义词。
- cval标量,可选
如果 mode 为“constant”,用于填充输入边缘之外的值。默认为 0.0。
- truncate浮点数,可选
在此标准差数量处截断滤波器。默认为 4.0。
- radius无或整数,可选
高斯核的半径。如果指定,核的大小将为
2*radius + 1,并且 truncate 将被忽略。默认为 None。
- 返回:
- gaussian_filter1dndarray
注意
高斯核沿每个轴的大小将为
2*radius + 1。如果 radius 为 None,将使用默认的radius = round(truncate * sigma)。示例
>>> from scipy.ndimage import gaussian_filter1d
>>> import numpy as np
>>> gaussian_filter1d([1.0, 2.0, 3.0, 4.0, 5.0], 1)
array([ 1.42704095,  2.06782203,  3.        ,  3.93217797,  4.57295905])
>>> gaussian_filter1d([1.0, 2.0, 3.0, 4.0, 5.0], 4)
array([ 2.91948343,  2.95023502,  3.        ,  3.04976498,  3.08051657])
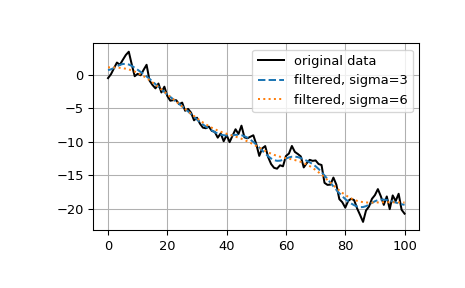
>>> import matplotlib.pyplot as plt
>>> rng = np.random.default_rng()
>>> x = rng.standard_normal(101).cumsum()
>>> y3 = gaussian_filter1d(x, 3)
>>> y6 = gaussian_filter1d(x, 6)
>>> plt.plot(x, 'k', label='original data')
>>> plt.plot(y3, '--', label='filtered, sigma=3')
>>> plt.plot(y6, ':', label='filtered, sigma=6')
>>> plt.legend()
>>> plt.grid()
>>> plt.show()
