心电图#
- scipy.datasets.electrocardiogram()[源]#
加载一个心电图作为一维信号的示例。
返回的信号是一个5分钟长的心电图(ECG),它是心脏电活动的医学记录,采样频率为360赫兹。
- 返回值:
- ecgndarray
采样的心电图数据,单位为毫伏(mV),采样频率为360赫兹。
注意事项
提供的信号是来自 记录 208(导联 MLII)的摘录(19:35 到 24:35),该记录由 MIT-BIH 心律失常数据库 [1] 在 PhysioNet [2] 上提供。该摘录包括噪声引起的伪影、典型心跳以及病理变化。
在 1.1.0 版本中添加。
参考文献
[1]Moody GB, Mark RG. The impact of the MIT-BIH Arrhythmia Database. IEEE Eng in Med and Biol 20(3):45-50 (May-June 2001). (PMID: 11446209); DOI:10.13026/C2F305
[2]Goldberger AL, Amaral LAN, Glass L, Hausdorff JM, Ivanov PCh, Mark RG, Mietus JE, Moody GB, Peng C-K, Stanley HE. PhysioBank, PhysioToolkit, and PhysioNet: Components of a New Research Resource for Complex Physiologic Signals. Circulation 101(23):e215-e220; DOI:10.1161/01.CIR.101.23.e215
示例
>>> from scipy.datasets import electrocardiogram
>>> ecg = electrocardiogram()
>>> ecg
array([-0.245, -0.215, -0.185, ..., -0.405, -0.395, -0.385], shape=(108000,))
>>> ecg.shape, ecg.mean(), ecg.std()
((108000,), -0.16510875, 0.5992473991177294)
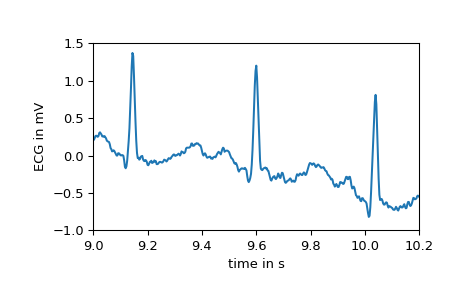
如前所述,该信号具有多个形态不同的区域。例如,前几秒显示了心脏在正常窦性心律下的电活动,如下所示。
>>> import numpy as np
>>> import matplotlib.pyplot as plt
>>> fs = 360
>>> time = np.arange(ecg.size) / fs
>>> plt.plot(time, ecg)
>>> plt.xlabel("time in s")
>>> plt.ylabel("ECG in mV")
>>> plt.xlim(9, 10.2)
>>> plt.ylim(-1, 1.5)
>>> plt.show()
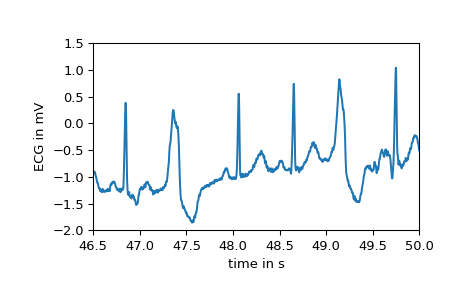
然而,在第16秒后,首次出现了室性早搏,也称为期外收缩。与典型心跳相比,它们的形态不同。这种差异在下面的图中可以很容易地观察到。
>>> plt.plot(time, ecg)
>>> plt.xlabel("time in s")
>>> plt.ylabel("ECG in mV")
>>> plt.xlim(46.5, 50)
>>> plt.ylim(-2, 1.5)
>>> plt.show()
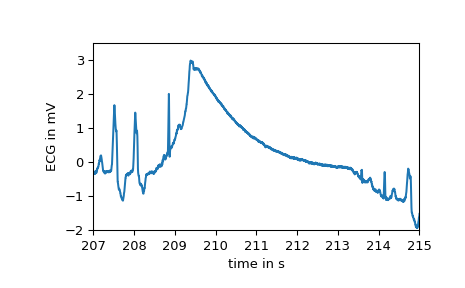
在几个点上,大的伪影干扰了记录,例如:
>>> plt.plot(time, ecg)
>>> plt.xlabel("time in s")
>>> plt.ylabel("ECG in mV")
>>> plt.xlim(207, 215)
>>> plt.ylim(-2, 3.5)
>>> plt.show()
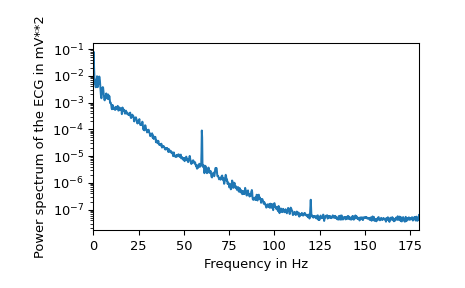
最后,检查功率谱显示大部分生物信号由较低频率组成。在60赫兹处可以清楚地观察到由市电引起的噪声。
>>> from scipy.signal import welch
>>> f, Pxx = welch(ecg, fs=fs, nperseg=2048, scaling="spectrum")
>>> plt.semilogy(f, Pxx)
>>> plt.xlabel("Frequency in Hz")
>>> plt.ylabel("Power spectrum of the ECG in mV**2")
>>> plt.xlim(f[[0, -1]])
>>> plt.show()